
Contents
General State of the Economy
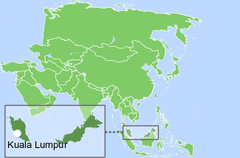
Malaysia is a country in Southeast Asia consisting of two noncontiguous regions separated by the South China Sea. Peninsular Malaysia borders with Thailand to the north, and East Malaysia located on the island of Borneo shares it with Brunei and Indonesia. In addition, Malaysia has maritime borders with Singapore, Vietnam, the Philippines, Indonesia, and Thailand.
| Malaysia | ||
|---|---|---|
| Capital: Kuala Lumpur | Density: 101/km2 | Currency: Malaysian ringgit (RM) (MYR) |
| Official languages: Malay | Life expectancy at birth: 76.13 years | GDP (PPP): $1.307 trillion (2024 est.) |
| National Day: 31 August | Area (land): 328,657 km2 | GDP - per capita (PPP): $39,069 (2024 est.) |
| Population: 33,200,000 (2023 est.) | Coastline: 4,675 km | Internet country code: .my |
Source: [1,2,3]
According to 2023 statistics, Malaysia, which ranks 68th in the world in terms of the size of its territory, is home to around 34 million people. In terms of population density, the country occupies the 121st place in the world. The length of the country’s coastline is 4,675 km (Peninsular Malaysia – 2,068 km, East Malaysia – 2,607 km). Malaysia is a federal parliamentary constitutional monarchy. The national capital and the country's largest city is Kuala Lumpur and the city of Putrajaya serves as the administrative center of Malaysia. The country is divided into 13 states and one federal territory [1,2,3].
Kuala Lumpur at night
The rating positions of Malaysia relative to other countries have been determined for an extensive list of economic, energy, innovative and educational indices, as well as for metrics reflecting the state of the environment. The economic indices include, for example, GDP per capita, annual average GDP growth, high-technology exports, and others. The list of energy indices includes proven reserves of oil, gas and coal, production-consumption ratio combined, and energy use, etc. Each of the indices has a ranked list of included member countries. Since the number of countries in each rating is different for each index, the positioning of the country of interest is displayed on a special chart, where the vertical axis is a uniform relative scale from 0 to 1, whereas the horizontal axis denominates the various indices and respective numbers relating to the descriptions given underneath.
Thus, in such a relative “0-1” diagram, the country’s position is marked with a dot in proportion to its location in the original rating list. If the country is among the leaders regarding the selected indicator, it will be marked close to 1 in the upper green zone on the relevant chart “0-1”, if the country is an outsider in the rating list, then it will be marked in the lower red zone of the chart “0-1”, etc.
Ranking position of Malaysia for list of economic indices:
| Sources: 1. GDP (purchasing power parity), 2020 est. / The World Factbook/Library/Central Intelligence Agency *228 2. GDP - per capita (PPP), 2020 / The World Factbook/Library/Central Intelligence Agency *229 3. Inflation rate (consumer prices), 2019 est. / The World Factbook/Library/Central Intelligence Agency *228 4. Charges for the use of intellectual property, receipts (BoP, current US$), 2020 / International Monetary Fund, Balance of Payments Statistics Yearbook, and data files. / License: CC BY-4.0 *88 5. The Global Competitiveness Index 2019 / Rankings / Reports / World Economic Forum *141 6. High-technology exports (current US$) 2019-2020 / United Nations, Comtrade database through the WITS platform / License: CCBY-4.0 / Data *134 7. 2021 Index of Economic Freedom / International Economies / The Heritage Foundation *178 8. Reserves of foreign exchange and gold, 2017 est. / The World Factbook / Library / Central Intelligence Agency *195 9. Annual average GDP growth in %, for the last 10 years (2011-2020) / World Bank national accounts data, and OECD National Accounts data files / License: CC BY-4.0 *206 10. Public debt (% of GDP), 2017 est. / The World Factbook / Library / Central Intelligence Agency (from smallest to largest) *210 * Total number of countries participating in ranking Figure 1. Economic Indices of Malaysia |
For the majority of indices the positioning of the country is higher than the world average, for seven indices Malaysia is placed among the top quarter of the world's countries included in the rating. Of the indices presented, the country has the highest values for High technology exports and Reserves (0.93), the 2021 Index of Economic Freedom (0.88), and Reserves of foreign exchange and gold (0.87). The weakest spot within Malaysian economics is the Public debt (% of GDP) (0.41), the only one indicator where the country takes up a position below the middle of the rankings.
Energy Resources
Malaysia has distinct proven reserves of fossil fuels in the form of natural gas and crude oil. The share of natural gas is 0.58% of the world’s total, the share of oil is 0.21%. The country's coal reserves are only 0.02% of the world total [4]. The share of Malaysia's population makes up about 0.42% of the world's population. However, at the same time, gas and oil reserves in Malaysia are significantly lower than those of the world leaders. For instance, gas reserves are about 20 times less than in Qatar, while oil reserves are more than 58 times less than in Iran [4,5].
In terms of tons of oil equivalent, according to 2024 data, conventional proved reserves by fuel type were: 62.3% – natural gas, 28.5% – oil, and 9.2% – coal (Fig.5).
Table 1. Fossil energy resources of Malaysia
| Resource /Explanations | Crude oil* | Natural gas* | Coal* | Tight Oil** | Shale Gas** |
|---|---|---|---|---|---|
| Value | 3.6 (0.21%) | 42 (0.58%) | 249 (0.02%) | no date | no date |
| Unit | billion barrels | Tcf | million short tons | - | - |
| Year | 2021 | 2020 | 2021 | - | - |
| Source | [4] | [4] | [4] | [-] | [-] |
*share of the country’s reserves in world total is provided in brackets
**unproved technically recoverable
Hydropower prevails in terms of installed renewable energy capacities (almost 89.2%), followed by bioenergy 9.4%), and solar photovoltaics (about 1.4%). Moreover, hydropower plays a significant role in Malaysia’s power generation, contributing about 16% to all electricity produced in 2021. However, the country does not completely use its very high overall hydropower potential (414,000GWh per year [5]).
Although some areas of Malaysia, such as the west-north coast of the island of Borneo, have relatively strong winds reaching 5.0-5.5 m/s at 50 m at certain times of the year, in general the country experiences low wind speeds. Thus, wind power does not have a strong potential in terms of the development of renewable energy sources. This doesn’t apply to solar power generation, which could be much higher due to the favourable climate conditions. The highest DNI solar intensity reaches 5.2-5.3 kWh/m2 per day, which is recorded in the north-eastern part of country, in Sabah state on the northern portion of Borneo.
Table 2. Renewable energy resources of Malaysia
| Resource/ Explanations | Hydro Energy Potential | Solar Potential (GHI)* | Wind Potential (50 м)* | Bio Potential (agricultural area) | Bio Potential (forest area) | Municipal Solid Waste |
|---|---|---|---|---|---|---|
| Value | 414,000GWh per year/4,000 potential sites for off-rive pumped hydro | 4.9-5.2 | 3.0-5.0 | 26.1 | 58.2 | 1.21 |
| Unit | - | kWh/m2/day | m/s | % of land area | % of land area | kg/per capita/day |
| Year | 2020/2023 | 2020 | 2020 | 2020 | 2020 | 2018 |
| Source | [6,7] | [8] | [9] | [10] | [11] | [12] |
*for the majority of the territory of the country
A rather extensive agricultural and forest area forms a decent resource base for the development of a number of bioenergy technologies, in particular, the production of biogas, bioethanol or biodiesel.
SULTAN ISMAIL PETRA. Country: MALAYSIA. Latitude: 6.17, Longitude: 102.29
Wind speed, m/s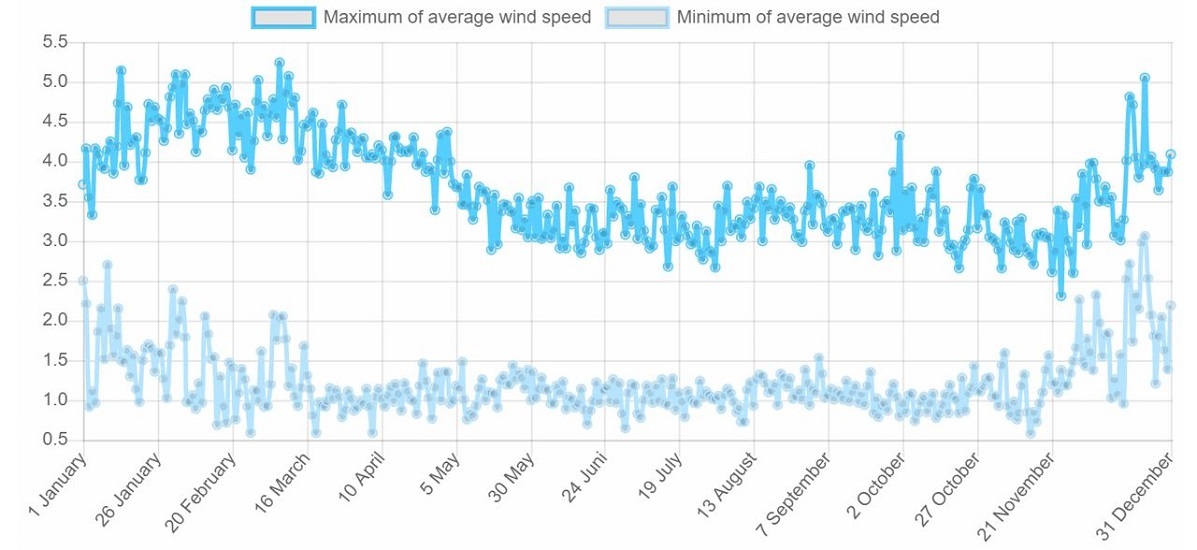
SULTAN ISMAIL PETRA. Country: MALAYSIA. Latitude: 6.17, Longitude: 102.29
Sky cover, %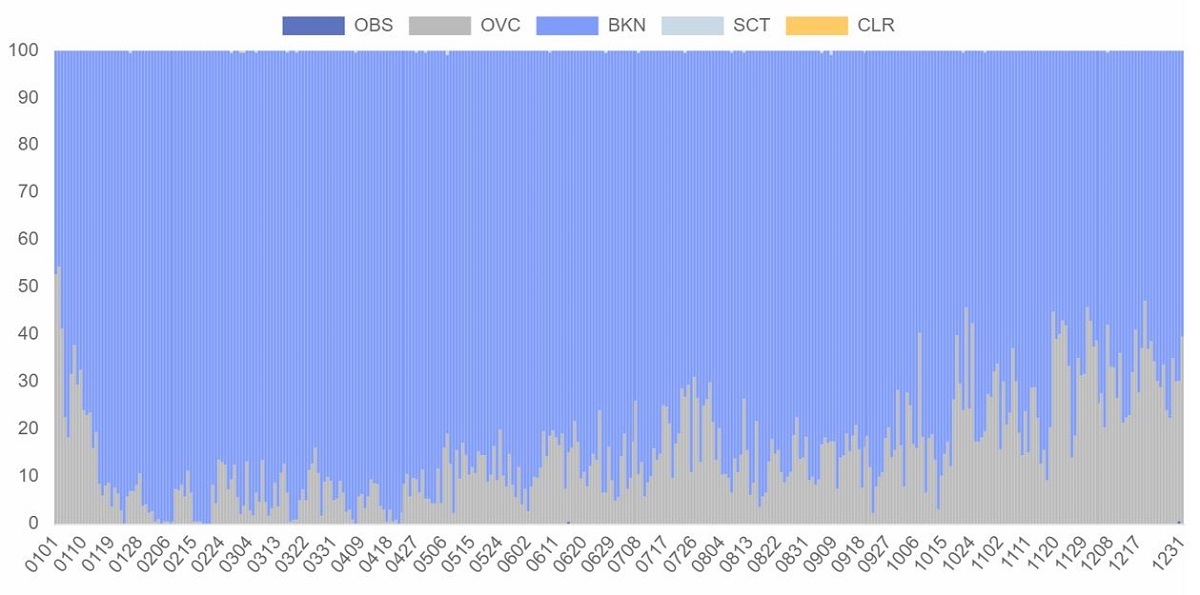
Energy Balance
According to [4], in 2022 in Malaysia, the total production of primary energy was 4.185 quadrillion Btu, while consumption was at the level of 3.954 quadrillion Btu. Thus, the share of domestic consumption in primary energy production was 94.5%. This makes Malaysia a country independent of energy imports. According to the BP Statistical Review of World Energy 2022, primary energy consumption in Malaysia in 2021 amounted to 4.19 exajoules and was dominated by natural gas – 35.3%, followed by oil – 34.8%, coal – 21.2%, hydroelectricity – 7.2%, and other renewables – 1.4% [5].
Source: U.S. Energy Information Administration (Mar 2024) / www.eia.gov
Figure 2. The Production and Consumption of fossil fuels in Malaysia (left — coal, in the center — gas, right — oil)
Malaysia's natural gas production far exceeds domestic demand: in 2022, gas consumption was almost half that of its production. In contrast, the consumption of coal is about 10 times higher than its production. In the last ten years, oil production and consumption have been roughly the same, with slight fluctuations in one direction or the other. In 2022, for example, oil consumption was approximately 10% higher than oil production.
Sources: U.S. Energy Information Administration (Mar 2024) / www.eia.gov | ||
| Figure 3. Electricity Generation in Malaysia |
Total electricity generation in Malaysia has grown by about 69% over the past ten years and consumption is entirely met by domestic production. In 2022, approximately 81.4% of electricity was produced by thermal power plants, 16.9% – by hydroelectric power plants, and 1.7% by other renewable sources.
| Sources: 1. Crude oil proved reserves, 2021 / International Energy Statistic/Geography / U.S. Energy Information Administration (Nov 2021)*98 2. Natural gas proved reserves 2021 / International Energy Statistic / Geography / U.S. Energy Information Administration (Nov 2021) *99 3. Total recoverable coal reserves 2019 / International Energy Statistic / Geography / U.S. Energy Information Administration (Nov 2021) *81 4. Combination production-consumption for Crude oil 2018 / International Energy Statistic / Geography / U.S. Energy Information Administration (Nov 2021) *219 5. Combination production-consumption for Natural gas 2019 / International Energy Statistic / Geography / U.S. Energy Information Administration (Nov 2021) *123 6. Combination production-consumption for Coal 2019 / International Energy Statistic / Geography / U.S. Energy Information Administration (Nov 2021) *128 7. Electricity – from other renewable sources (% of total installed capacity), 2017 est. / The World Factbook / Library / Central Intelligence Agency *170 8. GDP per unit of energy use (PPP per unit of oil equivalent), 2020 *66 Primary energy consumption - BP Statistical Review of World Energy 2021/BP;GDP (purchasing power parity) - The World Factbook/Library/Central Intelligence Agency 9. Energy use (primary energy use of oil equivalent per capita) 2020 *127 Primary energy consumption – BP Statistical Review of World Energy 2021; Population - United Nations, Department of Economic and Social Affairs, Population Division (2019). World Population Prospects 2019, custom data acquired via website. Retrieved 15 November 2021*66 10. The Global Energy Architecture Performance Index Report (EAPI) 2017 / Rankings / Reports / World Economic Forum 11. Electric power consumption (kWh per capita), 2016 *217 Electricity Consumption - The World Factbook / Library / Central Intelligence Agency; Population - United Nations, Department of Economic and Social Affairs, Population Division (2019). World Population Prospects 2019, custom data acquired via website. Retrieved 15 November 2021 12. Combination of electricity production-consumption (kWh)/The World Factbook/Library/Central Intelligence Agency *216 * Total number of countries participating in ranking Figure 4. Energy indices of Malaysia |
Malaysia’s significant fossil fuel resources are definitely reflected in the energy index chart, where the country has the best indices among those presented for the Production-consumption ratio of natural gas (0.93) and crude oil (0.86). In contrast, the weakest spot in Malaysia’s energy indicators is the Сoal production-consumption ratio (0.05), since coal demand far exceeds domestic output. Insufficient involvement of renewables in the country's energy mix has contributed to the relatively low rating in the indicator for the Electricity production from other renewable sources (0.34) and in the The Global Energy Architecture Performance Index Report (0.32).
Energy Infrastructure
A territorial map showing distribution of the largest infrastructure projects of the fossil fuel sector in Malaysia is displayed in Figure 5. As mentioned earlier, natural gas reserves account for 62.3% of all proven reserves of fossil fuels, oil – for 28.5%, and coal – for 9.2%.
The main gas fields under development are located offshore, both in Peninsular Malaysia, and in the regions of Sabah and Sarawak. Key natural gas processing plants are concentrated in the eastern part of the Peninsular Malaysia. According to U.S. Energy Information Administration, as of 2019, Malaysia is the fifth-largest exporter of LNG in the world. The giant Malaysian LNG export facility is located in the small town of Bintulu in Sarawak state, where the first commercial gas-to-liquids plant from Shell also operates.
Figure 5. Basic infrastructural facilities of the fossil fuel sector in Malaysia (click on the map to view a PDF version)
Most of the Malaysian crude oil comes from marine fields on the country's continental shelf. The map above illustrates the main offshore oil extraction fields, operating refineries and oil storages in both parts of the country. The Pengerang terminal at the southern tip of Peninsular Malaysia is the country’s largest commercial oil storage facility.
Coal mining is carried out mainly in Borneo Malaysia, in the states of Sabah and Sarawak.
Figure 6. Electricity production in Malaysia (click on the map to view a PDF version)
Electricity generation in Malaysia is to about 81% provided by fossil fuel-fired power stations, met mostly by coal and natural gas. Hydropower also plays a significant role, accounting for about 69% of Malaysia's generating capacity, with the Bakun power plant in Malaysian Borneo being the largest hydropower facility in the country with an installed capacity of 2,400 MW. As Figure 3 shows, the demand for electricity in Malaysia continues to grow year after year, and the government plans to reform the country's power sector, not least by tapping and further developing its relatively abundant hydropower resources [13].
Figure 7. Renewable energy in Malaysia (click on the map to view a PDF version)
Hydropower prevails in terms of installed renewable energy capacities (about 70%), followed by solar photovoltaics (about 20%). The share of bioenergy in 2021 was just over 10%. At the same time, the volume of electric power generation by hydroelectric power plants in 2021 was about 89.2% of the total of all renewable sources, followed by bioenergy (9.4%) and solar PV (1.4%). Solar power plants are distributed across the Peninsular Malaysia with the installed capacity between 18 and 66 MWel. Among other sectors of renewable energy, bioenergy is under active development in Malaysia, especially the production of biogas and biodiesel.
According to the National Energy Policy Plan, the Malaysian government aims to achieve carbon neutrality and 70% renewable energy in the energy mix by 2050. Reaching this goal will require more than a tenfold increase in capacity from 2023 to 2050. The country has set a target of 40% renewable energy in the energy mix by 2035 [13].
Education and Innovation
The following chart shows Malaysia’s positions in terms of education and innovation:
Sources: 1. The Global Innovation Index 2021, Rankings / Knowledge / World Intellectual Property Organization / Cornell University, INSEAD, and WIPO (2021): Energizing the World with Innovation. Ithaca, Fontainebleau, and Geneva *132 2. Patent Grants 2011-2020, resident & abroad / Statistical country profiles / World Intellectual Property Organization *185 3.Patents in Force 2020 / Statistical country profiles / World Intellectual Property Organization *109 4. QS World University Rankings 2022 *97 5. SCImago Country Rankings (1996-2020) / Country rankings / SCImago, (n.d.). SIR-SCImago Journal & Country Rank [Portal]. Retrieved 17 Nov 2021 *240 6. Internet users in 2018 / The World Factbook / Central Intelligence Agency *229 7. Internet users in 2018 (% Population) / The World Factbook / Central Intelligence Agency *229 8. Government expenditure on education, total (% of GDP), 2019 / United Nations Educational, Scientific, and Cultural Organization (UNESCO) Institute for Statistics. License: CCBY-4.0 / Data as of September 2021*177 9. Research and development expenditure (% of GDP), 2018 / UNESCO Institute for Statistics. License: CCBY-4.0 / Data *119 10. Scientific and technical journal articles, 2018 / National Science Foundation, Science and Engineering Indicators. License: CCBY-4.0 / Data *197 * Total number of countries participating in ranking | ||
| Figure 8. The indices of education and innovation in Malaysia |
Malaysia shows no extremes in the education and innovation sector – all indices are located in the middle or in the upper part of the chart. Among them, Malaysia's best indicators relate to the Scientific and technical journal articles (0.90), the SCImago Country Rankings (0.87), and the Number of Internet Users (0.87). Patents in force (0.66) and Government expenditure on education (0.66) are the lowest indicators in the chart, but still above the world average.
Ecology and Environment Protection
Indicators related to environmental issues are presented in the following diagram:
| Sources: 1. CO2 total emission by countries 2020 / European Commission / Joint Research Centre (JRC) / Emission Database for Global Atmospheric Research (EDGAR)*208 2. CO2 per capita emission 2020/European Commission/Joint Research Centre (JRC) / Emission Database for Global Atmospheric Research (EDGAR) *208 3. Forest area 2020 (% of land area) / The Global Forest Resources Assessment 2020 / Food and Agriculture Organization of the United Nations *234 4. Forest area change 2010-2020 (1000 ha/year) / The Global Forest Resources Assessment 2020 / Food and Agriculture Organization of the United Nations *234 5. The Environmental Performance Index (EPI) 2020 / Rankings / Yale Center for Environmental Law & Policy / Yale University *180 6. Annual freshwater withdrawals (m3 per capita), 2017 *179 Annual freshwater withdrawals, total (billion m3), 2017 – Food and Agriculture Organization, AQUASTAT data. /License: CC BY-4.0; Population – United Nations, Department of Economic and Social Affairs, Population Division (2019). World Population Prospects 2019, custom data acquired via website. Retrieved 15 November 2021 7. The National Footprint Accounts 2017 (Biocapacity Credit / Deficit) / Global Footprint Network *188 8. Methane emissions (kt of CO2 equivalent), 2018 / Data for up to 1990 are sourced from Carbon Dioxide Information Analysis Center, Environmental Sciences Division, Oak Ridge National Laboratory, Tennessee, United States. Data from 1990 are CAIT data: Climate Watch. 2020. GHG Emissions. Washington, DC: World Resources Institute. Available at: License : Attribution-NonCommercial 4.0 International (CC BY-NC 4.0) *191 9. The Climate Change Performance Index (CCPI) 2022 / Overall Results / Jan Burck, Thea Uhlich, Christoph Bals, Niklas Höhne, Leonardo Nascimento / Germanwatch, NewClimate Institute & Climate Action Network *60 * Total number of countries participating in ranking | ||
| Figure 9. Environmental Indices of Malaysia |
Malaysia belongs to the group of countries with the largest amount of carbon dioxide (0.12) and methane emissions (0.19). These facts are partly responsible for its low ranking in the National Footprint Accounts (0.32) and the 2022 Climate Change Performance Index (0.11). On the other hand, among the positive indicators is the significant area of forests in the country (0.85), as well as a positive trend to their increase (0.92). In general, the environmental situation in the country requires significant improvement.
References
[1] List of sovereign states and dependencies by area / Wikipedia / en.wikipedia.org/wiki/List_of_sovereign_states_and_dependencies_by_area
[2] List of countries and dependencies by population density / Wikipedia / en.wikipedia.org/wiki/List_of_countries_and_dependencies_by_population_density
[3] Malaysia / The world factbook / Library / Central Intelligence Agency / www.cia.gov
[4] Malaysia / Geography / U.S. Energy Information Administration (December, 2022) / www.eia.gov/beta/international/analysis.cfm
[5] BP Statistical Review of World Energy 2020 - 2022 (PDF) / BP / www.bp.com
[6] Harnessing hydropower in Malaysia/ 7 December 2020/ https://www.waterpowermagazine.com/features/featureharnessing-hydropower-in-malaysia-8396270/
[7] Potential for pumped hydro energy storage in Malaysia/ 7 Mar 2023/ https://www.partnershipsforinfrastructure.org/newsroom/potential-pumped-hydro-energy-storage-malaysia
[8] Solar resource data obtained from the Global Solar Atlas, owned by the World Bank Group and provided by Solargis / Global Solar Atlas / globalsolaratlas.info
[9] Wind Map / Global Wind Atlas 2.0, a free, web-based application developed, owned and operated by the Technical University of Denmark (DTU) in partnership with the World Bank Group, utilizing data provided by Vortex, with funding provided by the Energy Sector Management Assistance Program (ESMAP). For additional information: https://globalwindatlas.info
[10] Agricultural land (% of land area) / Food and Agriculture Organization, electronic files and web site. License: CC BY-4.0 / Data / The World Bank / www.worldbank.org
[11] Forest area (% of land area) / Food and Agriculture Organization, electronic files and web site. License: CC BY-4.0 / Data / The World Bank / www.worldbank.org
[12] What a Waste 2.0 (PDF) / Resources / The World Bank / www.worldbank.org
[13] National Energy Policy 2022-2040 / Ministry of Economy / https://www.epu.gov.my/sites/default/files/2022-09/National%20Energy%20Policy_2022_2040.pdf
The sources of charts and curves are specified under the images.
For more information about the energy industry in Malaysia see here