
Contents
General State of the Economy
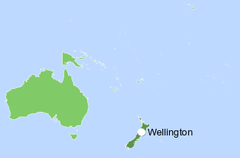
New Zealand is an archipelago in the South Pacific Ocean consisting of two main islands, the North Island and the South Island, along with over 700 smaller islands, some of which are hundreds of kilometers removed from the main group. Its nearest neighbor is Australia, located about 2,000 km to the northwest. In addition to Australia, New Zealand shares maritime borders with the islands of Fiji and Tonga. The country's coastline stretches across 15,134 kilometers.
According to 2023 statistics, New Zealand, which ranks 77th in the world in terms of the size of its territory, is home to around 5 million people. In terms of population density, the country occupies the 170th place in the world. The political form of government is parliamentary democracy under a constitutional monarchy. The administrative map of the country is divided into 16 regions and 1 territory. New Zealand's capital city is Wellington, and Auckland is its most populous urban area [1,2,3].
| New Zealand | ||
|---|---|---|
| Capital: Wellington | Density: 19.1/km2 | Currency: New Zealand dollar ($) (NZD) |
| Official languages: English, Māori, NZ Sign Language | Life expectancy at birth: 82.06 years | GDP (PPP): $279.183 billion (2023 est.) |
| National Day: 6 February | Area (land): 268,021 km2 | GDP - per capita (PPP): $53,809 (2023 est.) |
| Population: 5,159,440 (2023 est.) | Coastline: 15 000 km | Internet country code: .nz |
Source: [1,2,3,4,5]

The ranking positions of New Zeland relative to other countries have been determined for an extensive list of economic, energy, innovative and educational indices, as well as for metrics reflecting the state of the environment. The economic indices include, for example, GDP per capita, annual average GDP growth, high-technology exports, and others. The list of energy indices includes proven reserves of oil, gas and coal, production-consumption ratio combined, and energy use, etc. Each of the indices has a ranked list of included member countries. Since the number of countries in each rating is different for each index, the positioning of the country of interest is displayed on a special chart, where the vertical axis is a uniform relative scale from 0 to 1, whereas the horizontal axis denominates the various indices and respective numbers relating to the descriptions given underneath.
Thus, in such a relative “0-1” diagram, the country’s position is marked with a dot in proportion to its location in the original rating list. If the country is among the leaders regarding the selected indicator, it will be marked close to 1 in the upper green zone on the relevant chart “0-1”, if the country is an outsider in the rating list, then it will be marked in the lower red zone of the chart “0-1”, etc. A single list of indices is used for all countries. If a country is not in the ranking list for any index, then the corresponding position on the charts is not displayed.
| Sources: 1. GDP (purchasing power parity), 2020 est. / The World Factbook/Library/Central Intelligence Agency *228 2. GDP - per capita (PPP), 2020 / The World Factbook/Library/Central Intelligence Agency *229 3. Inflation rate (consumer prices), 2019 est. / The World Factbook/Library/Central Intelligence Agency *228 4. Charges for the use of intellectual property, receipts (BoP, current US$), 2020 / International Monetary Fund, Balance of Payments Statistics Yearbook, and data files. / License: CC BY-4.0 *88 5. The Global Competitiveness Index 2019 / Rankings / Reports / World Economic Forum *141 6. High-technology exports (current US$) 2019-2020 / United Nations, Comtrade database through the WITS platform / License: CCBY-4.0 / Data *134 7. 2021 Index of Economic Freedom / International Economies / The Heritage Foundation *178 8. Reserves of foreign exchange and gold, 2017 est. / The World Factbook / Library / Central Intelligence Agency *195 9. Annual average GDP growth in %, for the last 10 years (2011-2020) / World Bank national accounts data, and OECD National Accounts data files / License: CC BY-4.0 *206 10. Public debt (% of GDP), 2017 est. / The World Factbook / Library / Central Intelligence Agency (from smallest to largest) *210 * Total number of countries participating in ranking Figure 1. Economic Indices of New Zealand |
For all of the economic indicators shown in the chart, New Zealand is above the middle of the ranking lists. The country has the best indices among those presented for the Index of Economic Freedom (0.99), the Global Competitiveness Index (0.87) and the GDP per capita (0.84). The weakest spots in the country’s economic indicators are High-technology exports (0.56), Inflation rate (0.59) and Annual average GDP growth in % (0.60). Overall, New Zealand is financially stable country with relatively strong economic system.
Energy Resources
There are some deposits of natural gas and crude oil in New Zealand. The share of gas reserves is 0.015% of the world’s total, the share of oil is even less – 0.002%. New Zealand has extensive coal resources, which comprise 0.7% of the world’s total. According to the Ministry of Business, Innovation and Employment [6], New Zealand possesses more than 16 billion tons of coal reserves, of which 80% is lignite in the South Island.
In terms of tons of oil equivalent, according to 2024 data, conventional proved reserves were represented to 99.4% by coal, ahead of natural gas (0.5%), and oil (0.1%) (Fig.5).
Table 1. Fossil energy resources of New Zealand
| Resource /Explanations | Crude oil* | Natural gas* | Coal* | Tight Oil | Shale Gas | Coal Mine Methane |
|---|---|---|---|---|---|---|
| Value | 41 (0.002%) | 1.1 (0.015%) | 8 349 (0.7%) | no data | no data | 10.3 - 34.1 |
| Unit | million barrels | Tcf | million short tons | - | - | Bcm |
| Year | 2021 | 2020 | 2021 | - | - | 2018 |
| Source | [7] | [7] | [7] | [-] | [-] | [8] |
* share of the country’s reserves in world total is provided in brackets
New Zealand is a country with a huge potential for renewable energy, which is constantly being developed and utilized. Thus, according to the report Energy in New Zealand-2023 [9], the share of green energy in total energy consumption is about 30% and over 80% of generated electricity comes from renewable sources, providing New Zealand with one of the highest shares of renewable electricity in the world.
One of the major renewable energy sources in New Zealand is hydropower, based on the inflow of water into storage lakes upstream of the dam. In addition, due to the large number of volcanic areas, geothermal energy has high potential, especially in the Taupō and Kawerau regions, providing 22% of New Zealand's primary energy supply.
Although the solar market in New Zealand has grown over the past few years, it is the least developed of all renewable energy sources in the country. There is enough solar potential in the country to improve solar uptake. The greatest amount of sunshine is in the northern part of the North Island, where the solar irradiance level reaches 4.1 kWh/m2 per day.
The country's geographic location provides wind speeds higher than in other parts of the world, making wind a useful generating resource in New Zealand. In many areas of the country wind speeds reach 8 m/s at a height of 50 meters.
Table 2. Renewable energy resources of New Zealand
| Resource/ explanations | Solar Potential (GHI)* | Wind Potential (50 м)* | Bio Potential (agricultural area) | Bio Potential (forest area) | Geothermal Potenial | Municipal Solid Waste |
|---|---|---|---|---|---|---|
| Value | 3.5-4.0 | 6.0-8.0 | 38.6 | 37.6 | 3 600 | 1.99 |
| Unit | kWh/m2/day | m/s | % of land area | % of land area | MWe | kg/per capita/day |
| Year | 2020 | 2020 | 2020 | 2020 | 2016 | 2018 |
| Source | [10] | [11] | [12] | [13] | [14] | [15] |
*for the majority of the territory of the country
NEW ZEALAND. AUCKLAND INTL
Latitüde: -37.01 Longitude: 174.79
Average daily sky coverage over 10 years of observations, %
CLR - clear, SCT - scattered from 1/8 TO 4/8, BKN - broken from 5/8 TO 7/8, OVC - overcast, OBS - obscured, POB - partial obscuration
Source: based on NOAA U.S. Department of Commerce
Detailed information: Interactive map of solar resources
NEW ZEALAND. AUCKLAND INTL
Latitüde: -37.01, Longitude: 174.79
Average speed: 4.64 m/s, Operational share: 69%
Average daily wind speed for 10 years of observations, m/s, 10 m above the ground
Source: based on NOAA U.S. Department of Commerce
Detailed information: Interactive map of wind resources
New Zealand is a country with a relatively large area of forests, which gives it great potential for developing bioenergy and contributing to regional energy demand. The level of biomass utilization in the country is modest compared to its domestic potential. This concerns both the utilization of solid biomass in the form of forest residues and the production of liquid biofuels.
Energy Balance
According to [7], in 2022 in New Zealand, the total production of primary energy was 0.361 quadrillion Btu, while consumption was at the level of 0.616 quadrillion Btu. Thus, the share of domestic production in primary energy consumption was about 58.6%. This makes New Zealand an energy dependent country. This applies primarily to oil imports, as New Zealand is largely self-sufficient in other energy sources.
According to the Statistical Review of World Energy 2022, primary energy consumption in New Zealand in 2021 amounted to 0.84 Exajoules and was dominated by oil – 34.5% , followed by hydroelectricity –27.4%, natural gas –16.7%, renewables –13%, and coal –8.3% [16].
Source: U.S. Energy Information Administration (Mar 2024) / www.eia.gov
Figure 2. The production and consumption of fossil fuels in New Zealand (left – coal, in the center – gas, right – oil)
As can be seen from the graph above, there have been no dramatic changes in the consumption or production of the fossil fuels in New Zealand over the last 10 years, with the exception of coal, whose output has been gradually declining. According to [9], New Zealand, which has traditionally been a net exporter of coal, became an importer for the first time in 2021, and in 2022 the country produced the lowest amount of coal in 30 years.
In 2022, oil consumption was approximately 6 times higher than the country's domestic production capacity. As a result of the closure of the only refinery in 2022, the country switched to importing mostly refined petroleum products.
Sources: U.S. Energy Information Administration (Mar 2024) / www.eia.gov | ||
| Figure 3. Electricity generation in New Zealand |
Over the last 10 years, the amount of electricity generated and consumed in the country has remained at approximately the same level. With regard to the distribution of electricity generation sources, there has been a slight increase in renewable energy, not counting hydroelectricity, whose contribution has already been significant for many years.
According to electricity statistics provided by the Ministry of Business, Innovation and Employment [9], in 2022 New Zealand will generate about 43,500 gigawatt hours of electricity per year, with a total renewable share of more than 85%. The total power generation was distributed as follows: hydropower – 60%, geothermal – 18%, natural gas – 9.9%, wind – 6.5%, and coal – 2.9%.
| Sources: 1. Crude oil proved reserves, 2021 / International Energy Statistic/Geography / U.S. Energy Information Administration (Nov 2021)*98 2. Natural gas proved reserves 2021 / International Energy Statistic / Geography / U.S. Energy Information Administration (Nov 2021) *99 3. Total recoverable coal reserves 2019 / International Energy Statistic / Geography / U.S. Energy Information Administration (Nov 2021) *81 4. Combination production-consumption for Crude oil 2018 / International Energy Statistic / Geography / U.S. Energy Information Administration (Nov 2021) *219 5. Combination production-consumption for Natural gas 2019 / International Energy Statistic / Geography / U.S. Energy Information Administration (Nov 2021) *123 6. Combination production-consumption for Coal 2019 / International Energy Statistic / Geography / U.S. Energy Information Administration (Nov 2021) *128 7. Electricity – from other renewable sources (% of total installed capacity), 2017 est. / The World Factbook / Library / Central Intelligence Agency *170 8. GDP per unit of energy use (PPP per unit of oil equivalent), 2020 *66 Primary energy consumption - BP Statistical Review of World Energy 2021/BP;GDP (purchasing power parity) - The World Factbook/Library/Central Intelligence Agency 9. Energy use (primary energy use of oil equivalent per capita) 2020 *127 Primary energy consumption – BP Statistical Review of World Energy 2021; Population - United Nations, Department of Economic and Social Affairs, Population Division (2019). World Population Prospects 2019, custom data acquired via website. Retrieved 15 November 2021*66 10. The Global Energy Architecture Performance Index Report (EAPI) 2017 / Rankings / Reports / World Economic Forum 11. Electric power consumption (kWh per capita), 2016 *217 Electricity Consumption - The World Factbook / Library / Central Intelligence Agency; Population - United Nations, Department of Economic and Social Affairs, Population Division (2019). World Population Prospects 2019, custom data acquired via website. Retrieved 15 November 2021 12. Combination of electricity production-consumption (kWh)/The World Factbook/Library/Central Intelligence Agency *216 * Total number of countries participating in ranking Figure 4. Energy indices of New Zealand |
New Zealand’s dependency on imports of crude oil is definitely reflected in the energy index chart, where the country has the lowest indicator among those presented for the Production-consumption ratio of crude oil (0.17). In contrast, the strongest spots within New Zealand’s energy indicators are the Electric power consumption (0.89) and the Global Energy Architecture Performance Index (0.93). The strong involvement of renewables in the country's energy mix has contributed to the relatively good rating in the indicator for the Electricity production from other renewable sources (0.77).
Energy Infrastructure
A territorial map showing the distribution of the largest fossil fuel infrastructure projects in New Zealand is shown in Fig. 5. Hydrocarbon production in New Zealand is based entirely in the Taranaki Province, where all economically viable natural gas and crude oil deposits are concentrated. Development and production is supported by a well-developed infrastructure including processing plants and storage facilities.
The only oil refinery in the country, the Marsden Point, stopped operations in March 2022, transitioning to operating as a dedicated fuel import terminal, resulting in a 100% decrease in crude oil imports and a 159% increase in refined product imports [6].
There are several geological areas where coal is mined in New Zealand. The main one is the Waikato region in the North Island, where sub-bituminous coal is mined from large coal fields such as Maramarua and Rotowaro. According to the New Zealand Petroleum & Minerals, as at the end of 2022 there were 14 operating coal mines in the country [17]. 
Figure 5. Basic infrastructural facilities of the fossil fuel sector in New Zealand
As already noted, New Zealand produces and consumes about 43,500 gigawatt hours of electricity per year. The total power generation mix from renewable sources exceeds 87%, with hydropower accounting for the lion's share and supplying more than half of the country's energy needs. New Zealand has over 100 hydroelectric generating plants located all over the country. Manapōuri hydro power plant located in Fiordland National Park, South Island is the country's biggest hydroelectric station [18]. 
Figure 6. Electricity production in New Zealand
The country still generates electricity from gas-fired and combined cycle plants, many of which are scheduled to close in the coming years, making additional investments in renewable electricity generation. According to projections made by the Ministry of Business, Innovation and Employment, Huntley Station will be the only remaining combined cycle gas plant in the country in 2025 [9].
Figure 7. Renewable energy in New Zealand
Geothermal energy provides about 18% of the country's electricity, and New Zealand is home to some of the world's largest geothermal plants. The Wairakei Power Station on the North Island is the country's oldest geothermal plant and the first in the world to use steam from geothermal water as a power source [19].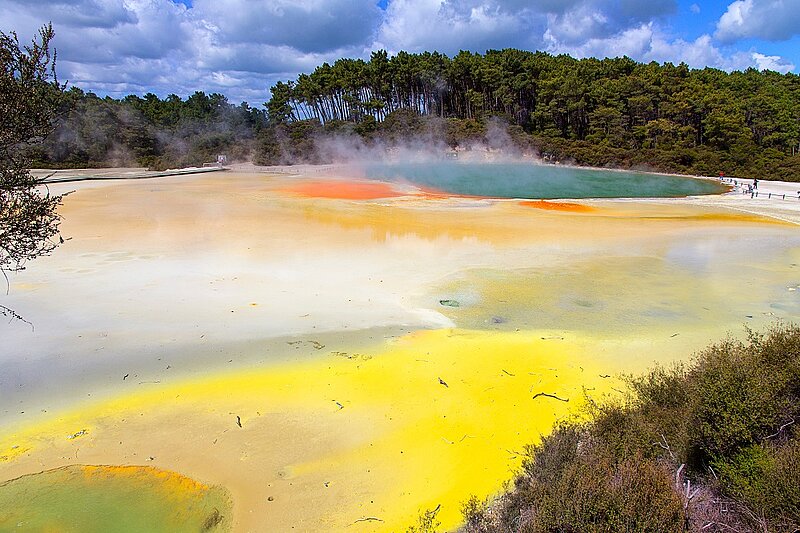
Waiotapu, active geothermal area in New Zealand, Taupo Volcanic Zone. Envato. VJTH3PRGF9
Solar energy is the most undeveloped renewable energy source in New Zealand. There are currently about 270 MW of solar generation installed in the country, with the majority being rooftop solar installations. There are a number of small solar farms in the country, while larger solar power plants are just starting to be built and some of which, such as the 32MW Edgecumbe solar power plant in the Bay of Plenty in the North Island, are scheduled to be operational in 2024 [20].
Wind power in New Zealand generates 6.5% of the country's electricity, a relatively small but growing proportion. According to the New Zealand Wind Energy Association, New Zealand has 19 wind farms operating around the country with 161 MW Tararua wind farm on the North Island being the country’s largest wind farm. Several large projects have now been approved that are expected to generate around 2,500 MW of wind power, and by 2035 wind power is expected to supply 20% of New Zealand's electricity needs. This is in line with the government's proposed target of 50% of total energy consumption from renewable sources by 2035, and 100% renewable electricity generation by 2030 [21].
Education and Innovation
Sources: 1. The Global Innovation Index 2021, Rankings / Knowledge / World Intellectual Property Organization / Cornell University, INSEAD, and WIPO (2021): Energizing the World with Innovation. Ithaca, Fontainebleau, and Geneva *132 2. Patent Grants 2011-2020, resident & abroad / Statistical country profiles / World Intellectual Property Organization *185 3.Patents in Force 2020 / Statistical country profiles / World Intellectual Property Organization *109 4. QS World University Rankings 2022 *97 5. SCImago Country Rankings (1996-2020) / Country rankings / SCImago, (n.d.). SIR-SCImago Journal & Country Rank [Portal]. Retrieved 17 Nov 2021 *240 6. Internet users in 2018 / The World Factbook / Central Intelligence Agency *229 7. Internet users in 2018 (% Population) / The World Factbook / Central Intelligence Agency *229 8. Government expenditure on education, total (% of GDP), 2019 / United Nations Educational, Scientific, and Cultural Organization (UNESCO) Institute for Statistics. License: CCBY-4.0 / Data as of September 2021*177 9. Research and development expenditure (% of GDP), 2018 / UNESCO Institute for Statistics. License: CCBY-4.0 / Data *119 10. Scientific and technical journal articles, 2018 / National Science Foundation, Science and Engineering Indicators. License: CCBY-4.0 / Data *197 * Total number of countries participating in ranking | ||
| Figure 8. The indices of education and innovation in New Zealand |
All New Zealand indices describing the country's positioning in the various international rankings related to education and innovation are above average. New Zealand has the highest rankings in Government expenditure on education (0.89), Internet users as % of population (0.88), and the SCImago Country Rankings (0.85). The lowest indicator of the country is QS World University Rankings 2022 (0.57). Overall, New Zealand's indexes in the education and innovation sector look quite convincing.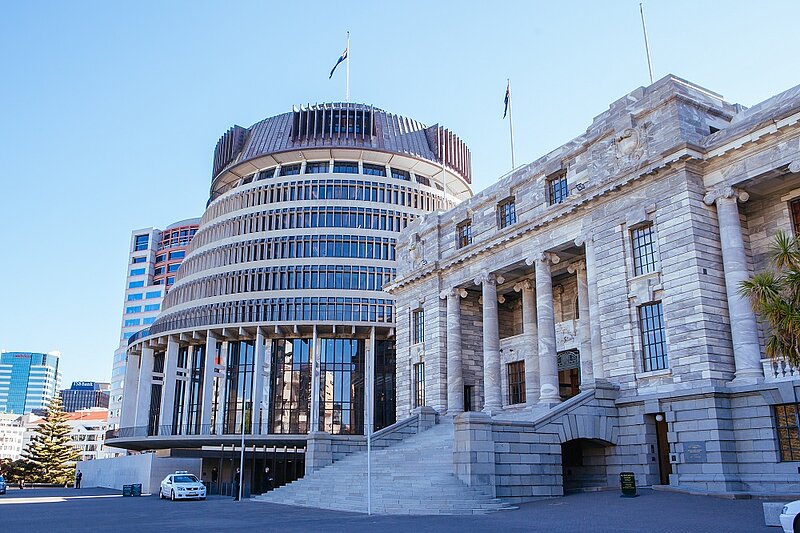
Wellington Parliament in New Zealand. Envato. RBS352TFYN
Ecology and Environment Protection
| Sources: 1. CO2 total emission by countries 2020 / European Commission / Joint Research Centre (JRC) / Emission Database for Global Atmospheric Research (EDGAR)*208 2. CO2 per capita emission 2020/European Commission/Joint Research Centre (JRC) / Emission Database for Global Atmospheric Research (EDGAR) *208 3. Forest area 2020 (% of land area) / The Global Forest Resources Assessment 2020 / Food and Agriculture Organization of the United Nations *234 4. Forest area change 2010-2020 (1000 ha/year) / The Global Forest Resources Assessment 2020 / Food and Agriculture Organization of the United Nations *234 5. The Environmental Performance Index (EPI) 2020 / Rankings / Yale Center for Environmental Law & Policy / Yale University *180 6. Annual freshwater withdrawals (m3 per capita), 2017 *179 Annual freshwater withdrawals, total (billion m3), 2017 – Food and Agriculture Organization, AQUASTAT data. /License: CC BY-4.0; Population – United Nations, Department of Economic and Social Affairs, Population Division (2019). World Population Prospects 2019, custom data acquired via website. Retrieved 15 November 2021 7. The National Footprint Accounts 2017 (Biocapacity Credit / Deficit) / Global Footprint Network *188 8. Methane emissions (kt of CO2 equivalent), 2018 / Data for up to 1990 are sourced from Carbon Dioxide Information Analysis Center, Environmental Sciences Division, Oak Ridge National Laboratory, Tennessee, United States. Data from 1990 are CAIT data: Climate Watch. 2020. GHG Emissions. Washington, DC: World Resources Institute. Available at: License : Attribution-NonCommercial 4.0 International (CC BY-NC 4.0) *191 9. The Climate Change Performance Index (CCPI) 2022 / Overall Results / Jan Burck, Thea Uhlich, Christoph Bals, Niklas Höhne, Leonardo Nascimento / Germanwatch, NewClimate Institute & Climate Action Network *60 * Total number of countries participating in ranking | ||
| Figure 9. Environmental Indices of New Zealand |
References
[1] List of sovereign states and dependencies by area / Wikipedia / https://en.wikipedia.org/wiki/List_of_sovereign_states_and_dependencies_by_area
[2] List of countries and dependencies by population density / Wikipedia / https://en.wikipedia.org/wiki/List_of_countries_and_dependencies_by_population_density
[3] New Zealand / The world factbook / Library / Central Intelligence Agency / https://www.cia.gov/
[4] GDP, PPP (constant 2011 international $) / World Bank, International Comparison Program database. License: CC BY-4.0 / Data / The World Bank / http://www.worldbank.org/
[5] GDP per capita, PPP (current international $) / World Bank, International Comparison Program database. License: CC BY-4.0 / Data / The World Bank / http://www.worldbank.org/
[6] Energy statistics / Ministry of Business, Innovation and Employment / https://www.mbie.govt.nz/building-and-energy/energy-and-natural-resources/energy-statistics-and-modelling/energy-statistics/coal-statistics/
[7] International Energy Statistic / Geography / New Zealand / U.S. Energy Information Administration / http://www.eia.gov/beta/international/
[8] Potential for the utilization of coal methane/ https://aenert.com/technologies/fossil-fuel/unconventional-gas/coal-seam-methane/
[9] Energy in New Zealnd-2023/ Ministry of Business, Innovation and Employment / https://www.mbie.govt.nz/assets/energy-in-new-zealand-2023.pdf
[10] Solar resource data obtained from the Global Solar Atlas, owned by the World Bank Group and provided by Solargis / Global Solar Atlas / http://globalsolaratlas.info/
[11] Wind Map / Global Wind Atlas 2.0, a free, web-based application developed, owned and operated by the Technical University of Denmark (DTU) in partnership with the World Bank Group, utilizing data provided by Vortex, with funding provided by the Energy Sector Management Assistance Program (ESMAP). For additional information: https://globalwindatlas.info
[12] Agricultural land (% of land area) /Food and Agriculture Organization, electronic files and web site. License: CC BY-4.0 / Data / The World Bank / http://www.worldbank.org/
[13] Forest area (% of land area) /Food and Agriculture Organization, electronic files and web site. License: CC BY-4.0 / Data / The World Bank / http://www.worldbank.org/
[14] 2016 Annual U.S. & Global Geothermal Power Production Report (PDF) / 2016 / Reports / Geothermal Energy Association / http://geoenergy.org/
[15] What a Waste 2.0 (PDF) / Resources / The World Bank / http://www.worldbank.org/
[16] BP Statistical Review of World Energy 2020-2022 (PDF) / BP / https://www.bp.com/
[17] Coal / New Zealand Petroleum and Minerals / https://www.nzpam.govt.nz/nz-industry/nz-minerals/minerals-statistics/coal/
[18] Manapōuri hydro station / Meridian / https://www.meridianenergy.co.nz/power-stations/hydro/manapouri
[19] New Zealand Geothermal Association/ Wairakei Geothermal System / https://www.nzgeothermal.org.nz/geothermal-in-nz/nz-geothermal-fields/wairakei/
[20] Solar generation now and in the future / 25 May 2023 / Electricity Athority / https://www.ea.govt.nz/news/eye-on-electricity/solar-generation-now-and-in-the-future/
[21] Wind farms operating and under construction / Wind Energy Association / https://www.windenergy.org.nz/operating-&-under-construction
The sources of charts and curves are specified under the images.
For more information about the energy industry in New Zealand see here