
Contents
General State of the Economy
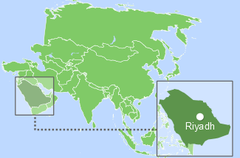
Saudi Arabia, the official name – the Kingdom of Saudi Arabia, is located on the Arabian Peninsula in South-West Asia. The northern border of the country separates it from Jordan, Iraq and Kuwait, the eastern border – from Qatar and the United Arab Emirates, the southeast – from Oman and the south – from Yemen. In the west the country has access to the Red Sea and in the north-east to the Persian Gulf.
According to 2022 statistics, Saudi Arabia, which in terms of size is 14th in the world, is home to around 35 million people. In terms of population density the country is 218th in the world out of 248 countries considered [1,2,3]. The total length of the country's coastline is 2 640 km [3]. The capital is Riyadh, the political form of government is an absolute theocratic monarchy, and the official language is Arabic. The administrative map of the country is divided into 13 provinces [3].
| Kingdom of Saudi Arabia / المملكة العربية السعودية | ||
|---|---|---|
| Capital: Riyadh | Density: 15/km2 | Currency: Saudi Rial (SR) (SAR) |
| Official languages: Arabic | Life expectancy at birth: 76.65 years | GDP (PPP): $1.543 billion (2020 est.) |
| National Day: 23 September | Area (land): 2,149,690 km2 | GDP - per capita (PPP): $44,300 (2020 est.) |
| Population: 35,354,380 (July 2022 est.) | Coastline: 2,640 km | Internet country code: .sa السعودية. |
Source: [1,2,3,4,5]
Saudi Arabia’s ranking positions relative to other countries have been determined for an extensive list of economic, energy, innovative and educational indices, as well as for metrics reflecting the state of the environment. The economic indices include, for example, GDP per capita, annual average GDP growth, high-technology exports, and others. The list of energy indices includes proven reserves of oil and gas, production-consumption ratio combined, and energy use, etc. Each of the indices has a ranked list of included member countries. Since the number of countries in each rating is different for each index, the positioning of the country of interest in the rating is displayed on a special chart, where the vertical axis is a uniform relative scale from 0 to 1, whereas the horizontal axis denominates the various indices and respective numbers relating to the descriptions given underneath.
Thus, in such a relative “0-1” diagram, the country’s position is marked with a dot in proportion to its location in the original rating list. If the country is among the leaders regarding the selected indicator, it will be marked close to 1 in the upper green zone on the relevant chart “0-1”, if the country is an outsider in the rating list, then it will be marked in the lower red zone of the chart “0-1”, etc.
Saudi Arabia is one of the most economically developed countries in the region, which is reflected in the comparative diagram of various economic indices – Figure 1.
| Sources: 1. GDP (purchasing power parity), 2020 est. / The World Factbook/Library/Central Intelligence Agency *228 2. GDP - per capita (PPP), 2020 / The World Factbook/Library/Central Intelligence Agency *229 3. Inflation rate (consumer prices), 2019 est. / The World Factbook/Library/Central Intelligence Agency *228 4. Charges for the use of intellectual property, receipts (BoP, current US$), 2020 / International Monetary Fund, Balance of Payments Statistics Yearbook, and data files. / License: CC BY-4.0 *88 5. The Global Competitiveness Index 2019 / Rankings / Reports / World Economic Forum *141 6. High-technology exports (current US$) 2019-2020 / United Nations, Comtrade database through the WITS platform / License: CCBY-4.0 / Data *134 7. 2021 Index of Economic Freedom / International Economies / The Heritage Foundation *178 8. Reserves of foreign exchange and gold, 2017 est. / The World Factbook / Library / Central Intelligence Agency *195 9. Annual average GDP growth in %, for the last 10 years (2011-2020) / World Bank national accounts data, and OECD National Accounts data files / License: CC BY-4.0 *206 10. Public debt (% of GDP), 2017 est. / The World Factbook / Library / Central Intelligence Agency(from smallest to largest) *210 * Total number of countries participating in ranking Figure 1. Economic Indices of Saudi Arabia |
The base of the economy is the oil sector, the income from which accounts for about 87% of the state budget and 42% of GDP [3]. In almost all cases, the positioning of the kingdom is higher than the world average, in the top half of the chart (i.e. among the 50% of countries included in the rating). Due to a significant resource base and a stable financial system, the GDP level, market value of publicly traded shares, reserves of foreign exchange and gold are in the top quarter of the graph (i.e. among the 25% of the best countries in the world included in the rating).
Since the early 1990s, the country has experienced a steady growth in GDP at purchasing power parity, both in general and per capita [4,5]. However, GDP at purchasing power parity decreased from $1.761 trillion in 2015 to $1.543 trillion (17th place in the world) in 2020 [3].
The country’s GDP at purchasing power parity per capita is somewhat lower (35th place in the world), which has been demonstrating negative dynamics: from $54 500 in 2017 to $44 300 in 2020 [3]. The inflation rate changed from 0.9% in 2017 to -2% in 2019; according to this indicator, the country is 3rd in the world [3].
According to the Global Competitiveness Report, presented by the World Economic Forum in 2019, Saudi Arabia is 36th out of an estimated total of 141 countries; notably, the country lost one positions in last year’s rating. This rating reflects the effectiveness of the use of the country’s own resources for sustainable development. In addition to a number of economic indicators this index also takes into account such variables as education, health, level of innovation, etc. In the list of countries that exported high-tech products in 2019-2020, the country was 65th out of 134 countries.
According to the Index of Economic Freedom, which is based on freedom of business, freedom from government action, property protection, and freedom from corruption, Saudi Arabia was 63rd in 2021 out of the 178 countries considered. In terms of gold reserves and foreign exchange reserves Saudi Arabia is 4th in the world.
According to the indicator for the average GDP growth in percentage over the last 10 years, in 2020 the country was 92nd out of 206 countries. In terms of public debt, calculated as a percentage of the country's GDP, Saudi Arabia was ranked 193rd out of 210 countries considered in 2017.
Energy resources
Saudi Arabia has the world's second largest oil reserves, after Venezuela, and the fifth largest natural gas reserves [6] (Table 1). It should be noted that the basis of oil reserves in Venezuela is heavy (extra heavy oil) oil, whose quality is inferior to most of Saudi oil. The share of oil reserves is 15.6% of the world’s total, the share of natural gas is 4.4% as well [6]. In terms of tons of oil equivalent, according to 2021 data, proved oil reserves were 80.6%, natural gas – 19.4% (Fig. 5).
Table 1. Fossil energy resources of Saudi Arabia
| Resource /Explanations | Crude oil* | Natural gas* | Coal | Shale Gas | Coal mine methane |
|---|---|---|---|---|---|
| Value | 258.6 (15.56%) | 320,257 (4.41%) | no data | no data | no data |
| Unit | billion barrels | Tcf | - | - | - |
| Year | 2021 | 2020 | - | - | - |
| Source | [6] | [6] | - | - | - |
*share of the country’s reserves in world total is provided in brackets
In absolute terms, proved oil reserves in the country at the end of 2020 were estimated at 259 billion barrels according to [6]; similar figures are given in [7] – 297.5 billion barrels; in source [3] – 258.6 billion barrels. According to the Ministry of Energy, Industry and Mineral Resources, proved oil reserves in the country in 2015 were at the level of 266.455 billion barrels [8].
Saudi Arabia, along with Russia, is the world's largest oil exporter (6.6 million barrels per day in 2020, down nearly 300,000 b/d from 2019), as well as one of the leading oil producers (9.2 million barrels per day in 2020), competing against Russia and the United States [6]. According to [6], primary energy production in Saudi Arabia is 2.7 times higher than consumption. The U.S. Energy Information Administration [6] estimated the reserves of natural gas in Saudi Arabia in 2021 at 333 Tcf, and the Central Intelligence Agency at 9.422 trillion m3 [3]. In the BP report, proved natural gas reserves in 2020 were 6 trillion m3 [7].
According to the Ministry of Energy, Industry and Mineral Resources, proved natural gas reserves in the country according to 2015 data were estimated at 303.251 Bcf [9], while according to the OAPEC report, at the end of 2016 they were 8 619 Bcm [10].
Saudi Arabia, due to its geographical location, has significant solar energy resources. Similar indicators for some other types of renewable energy sources do not look so convincing. A selection of basic indicators of this type of resources is presented in Table 2.
Table 2. Renewable energy resources of Saudi Arabia
| Resource/ Explanations | Solar Potential (DNI)* | Wind Potential (50 м)* | Bio Potential Agricultural area | Bio Potential Forest area | Geothermal Potential | Municipal Solid Waste |
|---|---|---|---|---|---|---|
| Value | 5.5-6.9 | 5.5-7.5 | 80.8 | 0.5 | 3000-5000 | 1.4 |
| Unit | kWh/m2/day | m/s | % of land area | % of land area | MW | kg/per capita/day |
| Year | 2020 | 2020 | 2020 | 2020 | 2015 | 2016 |
| Source | [11] | [12] | [13] | [14] | [15] | [16] |
*for most of the territory of the country
The level of direct solar radiation in most of the country is quite high at 5.5-6.9 kWh/m2/day [11]. The maximum level of solar radiation can be observed in the south west of the country and along the coast of the Red Sea – about 7.4-8.2 kWh/m2/day. The distribution of wind resources is as follows: in most of the country the wind speed does not exceed 5.5-7.5 m/s [12]. The peak of wind activity is noted in the coastal regions and in the north-east, where the wind speed can exceed 7.5 m/s at a height of 50 m [12]. About 80.7% of Saudi Arabia is covered by agricultural land and around 0.5% is forested [13,14]. According to 2015 data, the geothermal potential was estimated at 3 000-5 000 MW, which exceeds the potential of the Philippines and New Zealand [15].
The level of generation of municipal waste in Saudi Arabia in 2016 was 1.4 kg per capita per day, and is projected to grow to 1.7 kg per capita per day in 2025. This figure is significantly lower than that of most highly developed countries and roughly corresponds to that of the United Arab Emirates – 1.6 kg per capita per day [16].
Energy balance
In 2021 in Saudi Arabia, the total production of primary energy was 25.586 Btu, while consumption was at the level of 9.176 Btu. Thus, the share of domestic consumption in primary energy production is 36%, meaning that Saudi Arabia is largely energy independent. The country is an important exporter of crude oil and gas. Energy consumption per capita in 2021 was 268.99 million Btu per person, and energy consumption per GDP – 4.98 thousand Btu per USD at purchasing power parities [6].
According to the BP Statistical Review of World Energy 2022, total primary energy consumption in Saudi Arabia in 2021 was 10.82 exajoules, about 39% of which was natural gas, and 60.09% was oil, and renewables – 0.1% [7]. In the OAPEC report, energy consumption in 2016 was estimated at 4 539.4 thousand barrels of oil equivalent per day [10].
Despite periodic recessions, oil production in the country increased by approximately 30% between 2003 and 2015 (Fig. 2), and in 2021 it totalled 10 835 thousand barrels/day [6]. In BP's report, in 2021 production was estimated at 10 954 thousand barrels/day [7].
According to the Ministry of Energy, Industry and Mineral Resources, the country's oil production in 2015 was 10 192.6 thousand barrels/day [8].
Source: U.S. Energy Information Administration (Dec 2021) / www.eia.gov
Figure 2. The production and consumption of fossil fuels in Saudi Arabia (left – coal, in the center – gas, right – oil)
At the same time, the consumption of this resource steadily increased over the course of 15 years, and in 2019 it amounted to 3 182 thousand barrels/day [6]. According to [7], in 2021, oil consumption was at the level of 3 595 thousand barrels/day, according to OAPEC [10] report – 2 627.0 thousand barrels of oil equivalent/day.
According to [6] in 2019, crude oil exports were at the level of 3 185 thousand barrels/day. In BP's report [7], oil exports from Saudi Arabia were estimated at 7 696 thousand barrels per day in 2021. The main consumers of oil and oil products from Saudi Arabia are the countries of South-east Asia, the Pacific, India, and the USA [6].
Production and consumption of natural gas between 2001 and 2020 showed solid growth (Fig. 2) and in 2020 reached a level of 4 068 Bcf, compared to 1 986 Bcf in 2001 [6]. According to [7] gas production in 2021 was 117.3 billion m3, in 2015 [9] shows higher figures – 119.83 billion m3. The gas consumption in 202, according to the BP report, was at the level of 117.3 Bcm [7]. The Ministry of Energy, Industry and Mineral Resources in 2015 shows the following data – 627 676 thousand barrels [9], and [10] – 1 910.4 thousand barrels of oil equivalent per day in 2016.
Coal consumption in the country, according to 2016 data, was about 2 thousand barrels of oil equivalent per day [10].
Saudi Arabia almost completely relies on fossil resources to produce electricity (Figure 3.).
Sources: U.S. Energy Information Administration (Dec 2021) / www.eia.gov | ||
| Figure 3. Electricity production in Saudi Arabia |
Electricity production in the country in 2021 was at the level of 366.66 TWh (Fig.6). According to the OAPEC report, in 2016 the production of electricity was 345 104 GW/h, and consumption – 287 692 GW/h [10]. According to the BP report, the generation of electricity was estimated at 356.6 TWh in 2021 [7].
Saudi Arabia’s position in the comparative diagram of energy index is shown in Figure 4.
The indices, which are based on reserves of fossil fuels and export opportunities, show Saudi Arabia’s distinct advantage over most of the world. In the list of countries for the production of electricity from renewable sources (excluding hydropower), in 2017 the country was close to bottom of the list –205th out of 213 countries selected for consideration. In the Energy Architecture Performance Index 2017, which is based first on the level of economic growth, environmental safety, and energy independence of the country, including access to energy, Saudi Arabia is 121st out of 127 countries considered. However, it should be noted that during the last 8 years the country has lost 17 ranking positions.
| Sources: 1. Crude oil proved reserves, 2021 / International Energy Statistic/Geography / U.S. Energy Information Administration (Nov 2021)*98 2. Natural gas proved reserves 2021 / International Energy Statistic / Geography / U.S. Energy Information Administration (Nov 2021) *99 3. Total recoverable coal reserves 2019 / International Energy Statistic / Geography / U.S. Energy Information Administration (Nov 2021) *81 4. Combination production-consumption for Crude oil 2018 / International Energy Statistic / Geography / U.S. Energy Information Administration (Nov 2021) *219 5. Combination production-consumption for Natural gas 2019 / International Energy Statistic / Geography / U.S. Energy Information Administration (Nov 2021) *123 6. Combination production-consumption for Coal 2019 / International Energy Statistic / Geography / U.S. Energy Information Administration (Nov 2021) *128 7. Electricity – from other renewable sources (% of total installed capacity), 2017 est. / The World Factbook / Library / Central Intelligence Agency *170 8. GDP per unit of energy use (PPP per unit of oil equivalent), 2020 *66 Primary energy consumption - BP Statistical Review of World Energy 2021/BP;GDP (purchasing power parity) - The World Factbook/Library/Central Intelligence Agency 9. Energy use (primary energy use of oil equivalent per capita) 2020 *127 Primary energy consumption – BP Statistical Review of World Energy 2021; Population - United Nations, Department of Economic and Social Affairs, Population Division (2019). World Population Prospects 2019, custom data acquired via website. Retrieved 15 November 2021*66 10. The Global Energy Architecture Performance Index Report (EAPI) 2017 / Rankings / Reports / World Economic Forum 11. Electric power consumption (kWh per capita), 2016 *217 Electricity Consumption - The World Factbook / Library / Central Intelligence Agency; Population - United Nations, Department of Economic and Social Affairs, Population Division (2019). World Population Prospects 2019, custom data acquired via website. Retrieved 15 November 2021 12. Combination of electricity production-consumption (kWh)/The World Factbook/Library/Central Intelligence Agency *216 * Total number of countries participating in ranking Figure 4. Energy indices of Saudi Arabia |
When considering the GDP per unit of energy use, Saudi Arabia is 56th out of 66 countries surveyed, which is below the world average, while energy consumption per capita is much higher – 8th out of 66 countries.
In terms of electricity consumption per capita, the country is 21st in the world, however, for the indicator of combination of electricity production-consumption, Saudi Arabia is 16th in the ranked list of 216 countries.
Energy Infrastructure
A territorial map of the distribution of the largest infrastructure projects of the fossil fuel sector in Saudi Arabia is shown in Figure 5.
As previous mentioned, oil reserves account for 80.6% of the energy potential of fossil resources. The main oil reserves are concentrated in the east of the country near the capital and in the Dammam region (Fig. 5), and along the Persian Gulf. The largest oil field is the Ghawar Oil Field, which was discovered in 1948 [17] and, according to statistical data contains about 75 billion barrels of oil. Production of this field was estimated at 5.8 million barrels/day in 2012 [17]. The largest offshore fields, such as Safaniya and Manifa, contain heavier oil types – such as Arab Heavy crude, and produce about 1 million barrels per day.
The country's oil refineries, which are concentrated on the Red Sea coast, in the capital and on the Persian Gulf coast, have a total installed capacity of 3,299 thousand barrels/day (Fig. 5). The country's largest refinery is Ras Tanura, owned by Saudi Aramco, with an installed capacity of 550 000 barrels/day as of 2015 [18]. The main oil terminal is Ras Tanura (3.4 million barrels/day), and the largest oil storage facility is Jubail, with a reservoir of 9 170 462 barrels/day [19, 20].
Three types of oil pipelines connect the oil fields with the major refineries and consumers: pipelines for crude oil with a total length of 5 117 km; oil pipelines for the transportation of petroleum products with a length of 1 151; and oil pipelines for liquefied petroleum gas 1 183 km long (Fig.5).

Figure 5. Basic infrastructural facilities of the fossil fuel sector in Saudi Arabia
The largest gas fields, are also both continental and offshore (Fig. 5). The leading natural gas field is the Ghawar natural gas field; production from this field is 2.5 billion cf/d [21]. Gas is transported through a pipeline 2 940 km in length, as well as a pipeline for condensate with a length of 209 km (Fig. 5). The infrastructure of natural gas processing is represented by numerous plants located mainly in the eastern part of the country and on the shore of the Persian Gulf, the largest of which is the Wasit natural gas processing plant, with a capacity of 2.5 billion scfd [22].
The map of the territorial distribution of the largest infrastructure objects of electricity generation in Saudi Arabia is shown in Figure 6.
The share of fossil fuels in electricity generation in Saudi Arabia in 2016 was about 99.9% (Fig. 6).
Figure 6. Electricity and Renewable energy in Saudi Arabia
In Saudi Arabia there are 10 large gas power plants with a capacity of more than 300 MW, 12 oil stations with a capacity of more than 500 MW, 6 combined power plants with a capacity of 500 MW (Fig. 6), and a large number of stations with less output.
The largest gas-fired power plant is the Riyadh 7/8-A/8-B/9-A/9-B/9-E, SEC Natural gas-fired plant, with a total capacity of 4 742 MW [23]. The largest oil power plant – Riyadh-10, SEC with an installed capacity of 3 400 MW, and the most powerful combined power plant is Ghazlan (Ghizlan) I & II with a capacity of 4 528 MW [24,25].
As noted above, renewable energy in Saudi Arabia does not have a decisive influence on electricity generation. The level of scattered solar radiation in the most densely populated areas of the country can reach 7.0-8.0 kWh/m2/day, which is a good resource for the production of energy through photovoltaics. Nevertheless, the level of development of solar energy in Saudi Arabia is not comparable with the resource capabilities. In 2019 photovoltaic solar power plants of small and medium power produced about 0.68 TWh (Fig.6), Waad Al Shamal ISCC (50 MW) [26] and ISCC Duba 1 (43 MW) are under construction (Fig. 6). The largest photovoltaic station is the Dhahran Solar PV Plant with an installed capacity of 10.5 MW [27].
In April 2017, the Minister of Energy, Industry and Mineral Resources announced the new stage of the National Renewable Energy Program (NREP) and 30 renewable energy projects with a total capacity of 9.5 GW [28]. The National Center for Renewable Energy Data is being created, as well as the construction of a new 400 MW wind farm in Doumat Al Jandal and a number of photovoltaic power plants with a total capacity of 620 MW [28]. As part of the King Salman Renewable Energy Initiative, a 300 MW solar station was launched in the Sakaka area, and a 400 MW wind farm in the Midyan area is also planned to be launched [29].
Education and Innovation
The set of indices reflecting the position of Saudi Arabia among other countries in the field of education and innovation can be seen in Figure below. As can be seen from the diagram, Saudi Arabia is one of the world leaders in this segment of indicators, which in many ways predetermines its technological development in the field of energy. Saudi Arabia is 66th out of 132 countries considered in the ranking of countries of the Global Innovation Index (see diagram).
| Sources: 1. The Global Innovation Index 2021, Rankings / Knowledge / World Intellectual Property Organization / Cornell University, INSEAD, and WIPO (2021): Energizing the World with Innovation. Ithaca, Fontainebleau, and Geneva *132 2. Patent Grants 2011-2020, resident & abroad / Statistical country profiles / World Intellectual Property Organization *185 3.Patents in Force 2020 / Statistical country profiles / World Intellectual Property Organization *109 4. QS World University Rankings 2022 *97 5. SCImago Country Rankings (1996-2020) / Country rankings / SCImago, (n.d.). SIR-SCImago Journal & Country Rank [Portal]. Retrieved 17 Nov 2021 *240 6. Internet users in 2018 / The World Factbook / Central Intelligence Agency *229 7. Internet users in 2018 (% Population) / The World Factbook / Central Intelligence Agency *229 8. Government expenditure on education, total (% of GDP), 2019 / United Nations Educational, Scientific, and Cultural Organization (UNESCO) Institute for Statistics. License: CCBY-4.0 / Data as of September 2021*177 9. Research and development expenditure (% of GDP), 2018 / UNESCO Institute for Statistics. License: CCBY-4.0 / Data *119 10. Scientific and technical journal articles, 2018 / National Science Foundation, Science and Engineering Indicators. License: CCBY-4.0 / Data *197 * Total number of countries participating in ranking Figure 7. The indices of education and innovation in Saudi Arabia |
Saudi Arabia is certainly among the leaders of patenting in many areas of human activity, including energy technologies.
According to the number of patents granted to Saudi Arabian residents, both inside the country and abroad, the country ranks 30th in the world, however in terms of patents in force, the country is 61st out of 109 countries considered.
Saudi Arabia has very high indices of scientific publications in technological journals and is among the leaders in the number of Internet users. The level of government expenditure on education is relatively high – the country is 20th in the world for this indicator. Eight Saudi Arabian universities are included in the QS University Rating. In addition, Saudi Arabia’s GDP is relatively high, so the expenditure on education in absolute terms is very feasible.
Saudi Arabia is well positioned when considering the number of publications of specialists in scientific and technological journals. It is also regarded highly by the Scimago Journal and Country Rank. As such, Saudi Arabia ranks 38th out of 240 countries in the rating of Scimago, and in the Scientific and Technical Journal Activities – 37th out of 197 countries, and is the highest in the region.
About 24 Saudi Arabian universities, including the King Abdulaziz University, King Fahd University of Petroleum and Minerals, King Khalid University, King Saud University, and the Alfaisal University train specialists in various fields of energy, such as Petroleum Engineering, Natural Gas Engineering, Chemical Engineering, Environmental Engineering, Electrical Engineering, and Mining Engineering.
Saudi Basic Industries Corporation and the Saudi Arabian Oil Company are among the leaders of patenting among Saudi Arabian companies in the field of synthetic fuel production. Studies in this field have been conducted by the King Fahd University of Petroleum and Minerals and the King Abdulaziz City of Science and Technology. In the field of extraction and processing of unconventional oil, the Saudi Arabian Oil Company and the King Fahd University of Petroleum and Minerals have the highest number of patents. In the fields of associated petroleum gas and in the field of the extraction of hydrocarbons from low-permeability plays we mention the Saudi Arabian Oil Company.
In the field of bioenergy – Saudi Basic Industries Corporation. Studies in this field have been conducted by the King Abdulaziz University.
A large number of Saudi Arabian companies patent technical solutions in the field of energy production from renewable sources. In the field of solar energy the following universities should be mentioned: King Saud University, King Fahd University of Petroleum and Minerals, King Abdulaziz City of Science and Technology. King Fahd University of Petroleum and Minerals and the King Abdulaziz University have the highest number of publications in the field of wind energy.
Ecology and Environment Protection
| Sources: 1. CO2 total emission by countries 2020 / European Commission / Joint Research Centre (JRC) / Emission Database for Global Atmospheric Research (EDGAR)*208 2. CO2 per capita emission 2020/European Commission/Joint Research Centre (JRC) / Emission Database for Global Atmospheric Research (EDGAR) *208 3. Forest area 2020 (% of land area) / The Global Forest Resources Assessment 2020 / Food and Agriculture Organization of the United Nations *234 4. Forest area change 2010-2020 (1000 ha/year) / The Global Forest Resources Assessment 2020 / Food and Agriculture Organization of the United Nations *234 5. The Environmental Performance Index (EPI) 2020 / Rankings / Yale Center for Environmental Law & Policy / Yale University *180 6. Annual freshwater withdrawals (m3 per capita), 2017 *179 Annual freshwater withdrawals, total (billion m3), 2017 – Food and Agriculture Organization, AQUASTAT data. /License: CC BY-4.0; Population – United Nations, Department of Economic and Social Affairs, Population Division (2019). World Population Prospects 2019, custom data acquired via website. Retrieved 15 November 2021 7. The National Footprint Accounts 2017 (Biocapacity Credit / Deficit) / Global Footprint Network *188 8. Methane emissions (kt of CO2 equivalent), 2018 / Data for up to 1990 are sourced from Carbon Dioxide Information Analysis Center, Environmental Sciences Division, Oak Ridge National Laboratory, Tennessee, United States. Data from 1990 are CAIT data: Climate Watch. 2020. GHG Emissions. Washington, DC: World Resources Institute. Available at: License : Attribution-NonCommercial 4.0 International (CC BY-NC 4.0) *191 9. The Climate Change Performance Index (CCPI) 2022 / Overall Results / Jan Burck, Thea Uhlich, Christoph Bals, Niklas Höhne, Leonardo Nascimento / Germanwatch, NewClimate Institute & Climate Action Network *60 * Total number of countries participating in ranking Figure 8. Environmental indices of Saudi Arabia |
The environmental situation in the country is extremely negative; this is indicated by the country's positioning below the world average – most of the indices are at the bottom of the chart. First of all, the country demonstrates a relatively high level of CO2 and methane emissions, both per capita and in general.
At the same time, the situation is hindered by the fact that Saudi Arabia is at the bottom of the list of the 2022 Climate Change Performance Index (CCPI), which includes only 61 countries responsible for more than 90% of the world's energy-related CO2 emissions. According to the report, the country has the potential for the development of renewable energy, but dependence on fossil energy sources hampers its development.
In relation to the forest area as a percentage of total land area, Saudi Arabia is 219th in the world, and there is a very negative trend in forest area change. According to this indicator the country is 135th in the world.
Moreover, the country has a very low Environmental Performance Index (EPI) rating 2020, which focuses primarily on assessing the environmental performance of national governments. In this rating the country is 90th out of 180 member countries and demonstrates a positive trend.
According to The Environmental Vulnerability Index, which is based on years of observations and 50 indicators and includes for example, changing climatic characteristics or the quality of water resources, waste volumes, oil spills and other hazardous substances, etc. Saudi Arabia is 72nd out of 234 countries and is characterised as “vulnerable”.
At the end of the review it is also worth noting that, according to the Ecological Footprint Atlas, Saudi Arabia is among the environmental debtors.
References
[1] List of sovereign states and dependencies by area / Wikipedia / en.wikipedia.org/wiki/List_of_sovereign_states_and_dependencies_by_area
[2] List of countries and dependencies by population density / Wikipedia / en.wikipedia.org/wiki/List_of_countries_and_dependencies_by_population_density
[3] Saudi Arabia / The-world-factbook / Library / Central Intelligence Agency / www.cia.gov
[4] GDP, PPP (constant 2011 international $) / World Bank, International Comparison Program database. License: CC BY-4.0 / Data / The World Bank / www.worldbank.org
[5] GDP per capita, PPP (current international $)/ World Bank, International Comparison Program database. License: CC BY-4.0 / Data / The World Bank / www.worldbank.org
[6] Saudi Arabia / Geography / U.S. Energy Information Administration (December 2, 2021) / www.eia.gov
[7] BP Statistical Review of World Energy 2019-2022 (PDF) / BP / www.bp.com
[8] Petroleum statistics (PDF) / Ministry of Energy and Industry and Mineral Resources / www.meim.gov.sa
[9] Gas statistics (PDF) / Ministry of Energy and Industry and Mineral Resources / www.meim.gov.sa
[10] Annual Statistics Report 2017 (PDF) / AOPEC / www.oapecorg.org
[11] Solar resource data obtained from the Global Solar Atlas, owned by the World Bank Group and provided by So-largis / Global Solar Atlas / globalsolaratlas.info
[12] Wind Map / Global Wind Atlas 2.0, a free, web-based application developed, owned and operated by the Tech-nical University of Denmark (DTU) in partnership with the World Bank Group, utilizing data provided by Vortex, with funding provided by the Energy Sector Management Assistance Program (ESMAP). For additional information: globalwindatlas.info
[13] Agricultural land (% of land area) / Food and Agriculture Organization, electronic files and web site. Li-cense : CC BY-4.0 / Data / The World Bank / www.worldbank.org
[14] Forest area (% of land area) /Food and Agriculture Organization, electronic files and web site.License : CC BY-4.0 / Data / The World Bank / www.worldbank.org
[15] 2016 Annual US Global Geothermal Power Production (PDF) / Geothermal Energy Association / geo-energy.org
[16] World Bank What a Waste / Data / The World Bank / www.worldbank.org
[17] Country Analysis Brief: Saudi Arabia / U.S. Energy Information Administration (Oct 2017) / www.eia.gov
[ الطاقة الميميمية لفميااخ لامل الممفية المتفية لالمرميلة (ال ي يل [ 18 (Designed capacity of refineries inside the local and joint kingdom (thousand barrels / day) / Ministry of Energy, Industry and Mineral Resources of KAS / www.meim.gov.sa
[19] Saudi Arabia Oil and Gas Profile / A Barrel Full / abarrelfull.wikidot.com
[20] SabTank (Al Jubail) / Vopak / www.vopak.com
[21] Ghawar Oil field / Hydrocarbons Technology / www.hydrocarbons-technology.com
[22] Saudi Aramco (Wasit Gas Plant) / Wikimapia / wikimapia.org
[23] Project Power / Arabian BEMCO Contracting Co. / www.arabianbemco.com
[24] Riyadh-10, SEC Oil-fired power plant / Industry About / www.industryabout.com
[25] Gazlan I and II Thermal Power Plant Saudi Arabia / Global Energy Observatory /
www.globalenergyobservatory.org
[26] GE Wins Nearly $1 Billion Contract to Build SEC’s 1390 MW Waad Al Shamal Combined
Cycle Power Plant / December 31, 2015 / Business Wire / www.businesswire.com
[27] Saudi warms to solar to boost oil exports / February 19, 2017 / Gulf Times / www.gulf-times.com
[28] Saudi Energy Minister announces ‘new phase’ in Kingdom’s power generation as first round bids for Renewable Energy Projects opened (PDF) / April 17, 2017 / Power Saudi Arabia / www.powersaudiarabia.com.sa
[29] King Salman attends launch of Sakaka solar project / 21/11/2018 / Argaam Investment / www.argaam.com
Die Quellen der Diagramme und Kurven sind unter den Bildern angegeben.
Weitere Informationen zur Energiewirtschaft in Saudi-Arabien finden Sie hier