Energy industry in Russia

Contents
General State of the Economy
The Russian Federation’s territory covers much of Eastern Europe and the majority of northern Asia. Russia has land borders with 16 countries, including countries of the Commonwealth of Independent States and European Union, as well as Mongolia, China, and North Korea and shares seas with Japan and the USA. The country has access to the Pacific and Arctic Ocean, as well as the Baltic, Black and Azov seas.
Russia is the largest country in the world in terms of territory and is home to more than 141 million people, as of 2019. In terms of population density the country ranks 181st in the world [1,2,3]. Russia has the longest coastline in the world – 37 653 km [3].
Russia is a presidential-parliamentary republic and the official language is Russian. The administrative map of the country is divided into 46 regions, 21 republics, and 4 autonomous districts [3].
| Russia / Russian Federation | ||
|---|---|---|
| Capital: Moscow | Density: 8.4/km2 | Currency: Ruble (₽) (RUB) |
| Official languages: Russian | Life expectancy at birth: 71.34 years | GDP (PPP): $5.056 trillion (2023 est.) |
| National Day: 12 June | Area: 17,098,246 km2 | GDP - per capita (PPP): $35,309 (2023 est.) |
| Population: 144,699,673 (2022 est.) | Coastline: 37,654 km | Internet country code: .ru |
Source: [1,2,3,4,5]
Russia is a member of the BRICS association of major emerging economies, that also includes Brazil, India, China and South Africa. The country's economy is based on the oil and gas sectors, as well as the export of hydrocarbons, and therefore economic growth in the country is largely tied to the market price of these commodities. According to a number of indicators, Russia is among the top 25% of countries that have been included in the rating (Figure 1).
| Sources: 1. GDP (purchasing power parity), 2020 est. / The World Factbook/Library/Central Intelligence Agency *228 2. GDP - per capita (PPP), 2020 / The World Factbook/Library/Central Intelligence Agency *229 3. Inflation rate (consumer prices), 2019 est. / The World Factbook/Library/Central Intelligence Agency *228 4. Charges for the use of intellectual property, receipts (BoP, current US$), 2020 / International Monetary Fund, Balance of Payments Statistics Yearbook, and data files. / License: CC BY-4.0 *88 5. The Global Competitiveness Index 2019 / Rankings / Reports / World Economic Forum *141 6. High-technology exports (current US$) 2019-2020 / United Nations, Comtrade database through the WITS platform / License: CCBY-4.0 / Data *134 7. 2021 Index of Economic Freedom / International Economies / The Heritage Foundation *178 8. Reserves of foreign exchange and gold, 2017 est. / The World Factbook / Library / Central Intelligence Agency *195 9. Annual average GDP growth in %, for the last 10 years (2011-2020) / World Bank national accounts data, and OECD National Accounts data files / License: CC BY-4.0 *206 10. Public debt (% of GDP), 2017 est. / The World Factbook / Library / Central Intelligence Agency (from smallest to largest) *210 * Total number of countries participating in ranking Figure 1. Economic Indices of Russia |
Since the mid-1990s, the country has seen a steady growth in GDP at purchasing power parity, both as a whole and per capita, but in 2009 and between 2014-2015 both of these indicators showed a slight decline [4,5]. GDP at purchasing power parity grew from $3.963 trillion in 2015 to $4.016 trillion (6th in the world) in 2017 [3]. The country's GDP in terms of purchasing power parity per capita is significantly lower (74th place in 2017), the current dynamics of this indicator over the past two decades is also positive [5]. In recent years GDP per capita has grown from $27,500 in 2015 to $27,900 in 2017 [3]. The inflation rate, however, has almost halved from 7.1% in 2016 to 3.7% in 2017; according to this indicator, the country is in 149th place in the world [3]. It should be noted that this ranking of countries is purely statistical in nature and does not always correspond to the state of the economy. In terms of the market value of publicly traded shares in 2016, the country was in 20th place, significantly behind the leaders - China, the USA, the EU, but also behind Brazil, Spain and South Africa.
According to The Global Competitiveness Report 2019, presented by the World Economic Forum, Russia ranked 43rd (from 141 countries considered), placing it below Poland, Italy, Spain and Thailand. This rating measures the effectiveness of the use of the country’s own resources for sustainable development. In addition to numerous economic indicators this report also takes into account such factors as the level of education, health of the population, and the level of innovation.
In terms of high-technology exports in 2018, Russia was in 31st place, behind countries including Brazil, India and Israel. According to the Index of Economic Freedom which takes into account business freedom, freedom from government intervention, protection of property, and freedom from corruption, Russia was in 107th place out of 180 countries examined in 2018; in 2020 it had risen to 94th place and is considered "moderately free". In terms of gold and foreign exchange reserves Russia was in 8th place in 2017, behind China, Japan and the EU countries. In 2019 the Russian companies Gazprom, Lukoil and Rosneft were included in Fortune’s "Global 500”. list of the largest companies in the world.
Energy resources
Russia has the world's largest natural gas reserves, along with significant reserves of oil (8th in the world), and coal (Table 1) [3]. According to 2018-2019 data, proven coal reserves amounted to 67.8%, natural gas to 25.7%, and oil to 6.5%, of the total energy potential of the country's fossil resources in oil equivalent (Fig. 5). The matrix of unconventional resources looks somewhat different: kerogen oil accounts for 59.7%; light confined oil for 15.9%; shale gas for 11.7%; oil sands and heavy oil for 6.5%; coal mine methane for 2.9%; and associated gas for 3.3% ( Fig. 7).
According to [3,6], at the end of 2017 proven oil reserves amounted to 80 billion barrels, and according to [7], they were estimated at 107.2 billion barrels at the end of 2019.
At the beginning of 2018 proven reserves of natural gas in Russia were estimated at 47.8 trillion m³ [3]. The BP review cites lower figures for 2019 – 38 trillion m³ [7]. According to [6], natural gas reserves in the country amounted to 1,688 Tcf at the beginning of 2017. According to [6], proven coal reserves at the end of 2016 totalled 177 billion short tons; the figure for 2019 is presented in [7] – 162,166 million tons. Proven coal resources totalled slightly less than 70 billion tons in 2014 [8]; for comparison, in China reserves exceed 124 billion tons [8].
According to [9], the reserves of A + B + C1 category coal in Russia at the beginning of 2018 amounted to 112.9 billion tons, of which more than half was brown coal (58.9 billion tons), with the remaining 54 billion tons composed of hard coal and anthracite. Russia has the fourth largest uranium reserves in the world after Australia, Kazakhstan and Canada; in 2017 the IAEA estimated reserves at 485.6 thousand tons. In 2019 the State Balance of Mineral Reserves of the Russian Federation calculated Uranium reserves (A + B + C1) to exceed 330 thousand tons [9]. In addition to the aforementioned fossil-energy resources, Russia has significant reserves of unconventional resources (Table 1).
The country has significant reserves of shale gas, and the world's largest tight oil reserves which, according to 2013 data, amounted to 284.5 Tcf and 74.6 billion barrels, respectively [10]. According to the 2010 Survey of Energy Resources Report [11], the reserves of natural bitumen in Russia amounted to 28 367 million barrels; extra heavy oil to 6 million barrels; and kerogen oil (oil shale) to 247 883 million barrels. According to calculations by Advanced Energy Technologies, the potential for the utilization of coal mine methane and its reserves [7] (according to the methodology based on methane emissions from coal mining [12] ), amounted to 744-1 973 Bcm, as of 2019. CBM resources in Russia were estimated at 13.3-73.6 Tcm [13]; the Federal Institute for Geosciences and Natural Resources (BGR) [14] provided a figure of 12 550 Bcm of coalbed methane in 2014. In [15], according to an estimate by OAO Gazprom VNIIGAZ, the predicted methane resources in the coal basins of Russia total more than 80 Tcm.
Table 1. Fossil energy resources of Russia
| Resource/ Explanations | Crude oil* | Natural gas* | Coal* | Shale Gas** | Tight Oil** | Coal mine methane | Natural Bitumen | Extra Heavy Oil | Oil Shale |
|---|---|---|---|---|---|---|---|---|---|
| Value | 80(4.7%) | 1688(23.3%) | 178 757(15.4%) | 284.5 | 74.6 | 744-1 973 | 28 367 | 6 | 247 883 |
| Unit | billion barrels | Tcf | million short tons | Tcf | billion barrels | Bcm | Bcm | million barrels | million barrels |
| Year | 2021 | 2020 | 2021 | 2013 | 2013 | 2018 | 2008 | 2008 | 2008 |
| Source | [6] | [6] | [6] | [10] | [10] | [7,12] | [11] | [11] | [11] |
*share of the country’s reserves in world total is provided in brackets
**unproved technically recoverable
Russia, given its vast territory and diverse climatic zones and natural landscapes, has significant potential for the development of some types of renewable energy. A selection of the main indicators of this type of resources is presented in Table 2.
Table 2. Renewable energy resources of Russia
| Resource/ Explanations | Solar Potential (GHI)* | Wind Potential (50 м)* | Hydro energy Potential** | Bio Potential (agricultural area) | Bio Potential (forest area) | Geothermal Potential | Municipal Solid Waste |
|---|---|---|---|---|---|---|---|
| Value | 2.8-3.5 | 5.0-6.5 | 1 670 000 | 13.3 | 49.8 | 2 000 | 0.93 |
| Unit | kWh/m2/day | m/s | GWh/year | % of land area | % of land area | MW/m2 | kg/per capita/day |
| Year | 2019 | 2019 | 2016 | 2016 | 2016 | 2015 | 2012 |
| Source | [16] | [17] | [18] | [20] | [21] | [22] | [24] |
*for the majority of the territory of the country
** total potential
The level of horizontal solar radiation for the majority of the country is between 2.8-3.5 kWh/m²/day; in the south of the country, in the Caucasus and the Far East, this figure can reach 3.5-3.9 kWh/m²/day [16]. The distribution of wind resources is as follows: in most of the country, the wind speed is between 5.0-6.5 m/s; along the Pacific coast in the northeast, the Atlantic coast in the northwest, and the Arctic Ocean coast in the north, wind speed can reach a speed of 6.5-8.0 m/s at a height of 50 meters. Maximum wind speed is observed in the north-west, north and north-east of the country, along the coast of the Bering Sea and in the north, north-east of the country, in the Kuril Islands and Chukotka, where at an altitude of 90 m it can exceed 8.0 m/s [17].
In World Energy Resources Hydropower Report 2016, the total hydro potential of Russia was estimated at 1,670,000 GWh/year; only 10% of which is currently being utilized. In China this figure was 2,140,000 GWh/year with 41% utilization [18]. The economically available potential of hydropower in Russia can reach more than 850 TWh [19]. About 49.8% of the territory of Russia is forested [20], with 13.3% used as agricultural land [21]. Between 1992 and 2016 Russia was one of the few countries that saw a slight increase in its total forest area, while the area of land in the agricultural sector decreased [20,21]. Certain regions of Russia are tectonically active; in 2015 the potential of geothermal resources was estimated at 2,000 MWe [22].
According to the State Information System, geothermal water reserves in Russia with a temperature of between 40-200 0С and a depth of 3500 m can provide about 14 million m³ of hot water per day [23]. The level of municipal waste generation in Russia is 0.93 kg per person per day, which is slightly less than, for example, in neighbouring China – (1.02 kg per person per day). By 2025, this indicator is projected to increase to 1.25 kg per person per day. This resource is a valuable raw material for secondary use or energy production; however, processing technologies that allow for its utilization have not seen wide distribution in Russia [24].
Energy Balance
According to the BP Statistical Review of World Energy 2020, total primary energy consumption in Russia in 2019 was 29.81 exajoules: 53.7% from natural gas; 22.0% from oil; 12.2% from coal; 6.2% from nuclear power; 5.8% from hydropower; and 0.1% from other renewable resources [7].
Russia is one of the largest oil producers in the world, along with Saudi Arabia and the United States, and is the second largest natural gas producer after the United States [6]. Production of oil and other liquid hydrocarbons has soared since 2001 and reached 11.49 million barrels per day in 2019, up from 7.16 million barrels per day in 2001. The volume of oil consumption in the country has shown a slight increase since 2001 (Fig. 2) and in 2017 amounted to 3.7 million barrels/day [25].
In BP’s review, according to 2019 data , the production of all types of liquid hydrocarbons in Russia totals 11,540 thousand barrels per day, with consumption at 3,317 thousand barrels/day [7].
Oil exports from Russia in 2016 amounted to more than 5 million barrels/day (approximately 250 million tons per year) [6]. The main importers of Russian oil are European countries (70%) and Asian countries (30%) [6]. According to the Federal Customs Service and Rosstat, oil exports in 2019 amounted to 272.2 million tons [26]. In 2020, analysts predict a decline in oil exports [27].
Source: U.S. Energy Information Administration (Sep 2023) / www.eia.gov
Figure 2. The Production and consumption of fossil fuels in Russia (coal – left, gas – in the center, oil – right)
The ratio between production and consumption of natural gas has remained stable over the past two decades, averaging 23,500 Bcf and 16,800 Bcf, respectively [25]. According to the BP Statistical Review of World Energy June 2020 [7], gas production in 2019 totalled 679 billion m³, with domestic consumption at 444.3 billion m³.
According to [9], in 2019 production was 680.6 billion m³, 35.8 billion m³ more than in the previous year. According to US sources, in 2016, the National Oceanic and Atmospheric Administration (NOAA) in Russia burned around 850 Bcf of associated petroleum gas, which amounted to about 16% of the total gas flared in the world [6]. The Russian Statistical Yearbook 2019 provides data on the growth of associated petroleum gas production, which in 2018 amounted to 79.5 bcm. The volume of associated petroleum gas utilized in flares totalled to 14.7 billion m³, 18% more than in 2017 [28]. In 2016 the country exported 7.5 Tcf of natural gas, with EU countries receiving around 90% [6].
According to [9], in 2018 220.6 billion cubic meters of natural gas was exported, and LNG exports amounted to 36.7 million cubic meters. Russia is the sixth largest coal producer in the world. Production has been growing since 2001 and in 2017 totalled 449.57 million short tons [6], and in 2019, according to a BP report, 9.2 exajoules [7]. Coal consumption in the same period (2017) decreased slightly to 239.15 million short tons [6], with BP reporting a figure of 3.63 exajoules [7]. Coal exports from Russia in 2018 totalled 210 million tons; the main importers were South Korea, China and Japan [9].
Historically, Russia has relied heavily on fossil fuels to generate electricity (Figure 3).
Sources: U.S. Energy Information Administration (Sep 2023) / www.eia.gov | ||
| Figure 3. Electricity production in Russia |
Electricity production in the country in 2018 amounted to 1039.0 TWh (Fig. 8). The largest proportion came from fossil fuels – 64.1%, hydropower accounted for 18.0%, nuclear power – 17.5%, and other renewable sources – 0.4%. According to the Ministry of Energy of Russia, electricity generation amounted to 1080.6 billion kWh in 2019 [29].
Russia's position on the comparative chart of energy indices is presented in Figure 4. As already noted, Russia has the largest reserves of mineral resources, therefore the first six indices have extremely high indicators, particularly for the production / consumption ratio. Russia is among the world leaders in the production of oil and gas, and domestic consumption is at a low enough level to allow for significant exports.
| Sources: 1. Crude oil proved reserves, 2021 / International Energy Statistic/Geography / U.S. Energy Information Administration (Nov 2021)*98 2. Natural gas proved reserves 2021 / International Energy Statistic / Geography / U.S. Energy Information Administration (Nov 2021) *99 3. Total recoverable coal reserves 2019 / International Energy Statistic / Geography / U.S. Energy Information Administration (Nov 2021) *81 4. Combination production-consumption for Crude oil 2018 / International Energy Statistic / Geography / U.S. Energy Information Administration (Nov 2021) *219 5. Combination production-consumption for Natural gas 2019 / International Energy Statistic / Geography / U.S. Energy Information Administration (Nov 2021) *123 6. Combination production-consumption for Coal 2019 / International Energy Statistic / Geography / U.S. Energy Information Administration (Nov 2021) *128 7. Electricity – from other renewable sources (% of total installed capacity), 2017 est. / The World Factbook / Library / Central Intelligence Agency *170 8. GDP per unit of energy use (PPP per unit of oil equivalent), 2020 *66 Primary energy consumption - BP Statistical Review of World Energy 2021/BP;GDP (purchasing power parity) - The World Factbook/Library/Central Intelligence Agency 9. Energy use (primary energy use of oil equivalent per capita) 2020 *127 Primary energy consumption – BP Statistical Review of World Energy 2021; Population - United Nations, Department of Economic and Social Affairs, Population Division (2019). World Population Prospects 2019, custom data acquired via website. Retrieved 15 November 2021*66 10. The Global Energy Architecture Performance Index Report (EAPI) 2017 / Rankings / Reports / World Economic Forum 11. Electric power consumption (kWh per capita), 2016 *217 Electricity Consumption - The World Factbook / Library / Central Intelligence Agency; Population - United Nations, Department of Economic and Social Affairs, Population Division (2019). World Population Prospects 2019, custom data acquired via website. Retrieved 15 November 2021 12. Combination of electricity production-consumption (kWh)/The World Factbook/Library/Central Intelligence Agency *216 * Total number of countries participating in ranking Figure 4. Energy indices of Russia |
In terms of the share of electricity production from renewable energy sources (excluding hydropower) Russia, with 0.6% of installed capacity in 2015, was in 147th place, among 166 countries selected for consideration, almost 20 times behind Canada, a country with a similar climate and similar natural resources.
Russia is ranked 48th in the EAPI of 2017 (Energy Architecture Performance Index), which is based primarily on the level of economic growth, environmental safety, and energy independence of the country, including access to energy. This places the country behind most European states, Canada, South Korea, Japan, but slightly ahead of the USA and significantly ahead of China. It should be noted that over the past 8 years the country has lost 15 positions in the ranking.
In terms of GDP per unit of energy use in 2017, Russia demonstrated a critically low ranking – 61st out of 66 countries selected for consideration; however, in terms of energy use per capita it is much higher – 16th out of 66 countries selected for consideration. In terms of electricity consumption per capita, Russia is in the top half of the ranking. Likewise, the country is in the top quarter of the ranking in terms of the ratio of production-consumption of electricity.
Energy Infrastructure
The map showing the territorial distribution of the largest infrastructural projects of the fossil fuel sector in Russia is presented in Figures 5, 6, 7, 8. 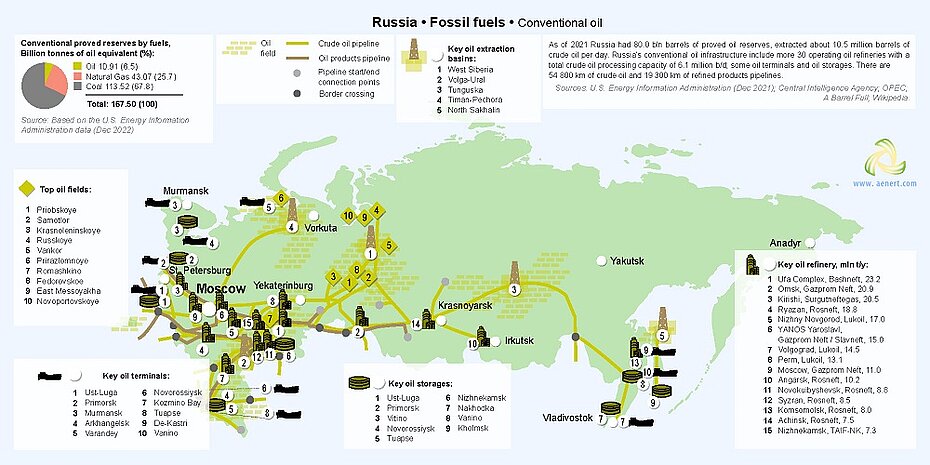
Figure 5. Basic infrastructure facilities of the fossil fuel sector in Russia: conventional oil (click on the map to view a PDF version)
Coal is the leader in the total potential of natural energy resources – 67.8%; the share of natural gas is 25.7%, and oil accounts for 6.5% (Fig. 5). The main deposits of liquid hydrocarbons are concentrated in the West Siberian oil and gas basin, which contains almost two-thirds of the total reserves and half of the oil resources. The largest oil field is Priobskoye, with reserves, as of January 2019, estimated at 1,165.9 million tons (A + B1 + C1) [9]. More than 30 refineries in Russia, as of January 1, 2017, had a total installed capacity of 5.1 million barrels/day (Fig. 5) [30]. The largest oil refining centre in the country is the Ufa Complex, owned by Rosneft (Bashneft), which includes three refineries with a total installed capacity of 23.5 million tons per year [31]. In 2016 Russian ports (Novorossiysk, Primorsk, Ust-Luga, and Kozmino) provided about 84% of oil exports, the export capacity of the largest of them, Novorossiysk, amounted to 1.407 million barrels per day [30]. In addition, the Novorossiysk fuel oil terminal has a throughput capacity of 5 million tons per year [32]. Crude oil is mainly transported through pipelines with a total length of 54,800 km, while oil products are transported through pipelines with a total length of 19,300 km (Figure 5). sector in Russia")
Figure 6. Basic infrastructure facilities of the fossil fuel sector in Russia: conventional natural gas (click on the map to view a PDF version)
The largest reserves of natural gas are located in the Yamal-Nenets Autonomous Okrug (55% of the Russian natural gas resource base) [9]. The richest field is Urengoyskoye of the West Siberian oil and gas basin, with reserves of A + B + C1 gas estimated at 5,492.1 billion m³ in 2019, and production in 2018 amounting to 121 billion m³ [9]. The main plants (Fig. 6) for processing natural gas and gas condensate are located in Western Siberia, near the fields. The largest gas processing plant is the Orenburg Gazprom natural gas processing plant with an installed capacity of 37.5 bcm. In the Far East, the construction of the Amur gas processing plant, with a design capacity of 42 bcm, is underway [33]. The largest gas storage facilities are located in the west of the country, where Gazprom owns 22 underground gas storage facilities, 26 gas storage facilities; by the end of 2019 - early 2020, Gazprom's UGS facilities’ gas reserves totalled over 72 billion m3 [34].
Liquefied gas is exported from the terminals of the Yamal LNG project and the Sakhalin LNG terminal, with a production capacity of 9.6 million tons of LNG per year; the main importer is Japan [35,30]. In 2019, the Kaliningrad LNG regasification terminal was commissioned, with a storage capacity of 174,100 m³ [36]. The terminal will be able to provide residents of the Kaliningrad region with up to 2.7 billion m³ of gas per year [37]. Gas is transported within Russia through a network of pipelines with a total length of 177,700 km (Fig. 6).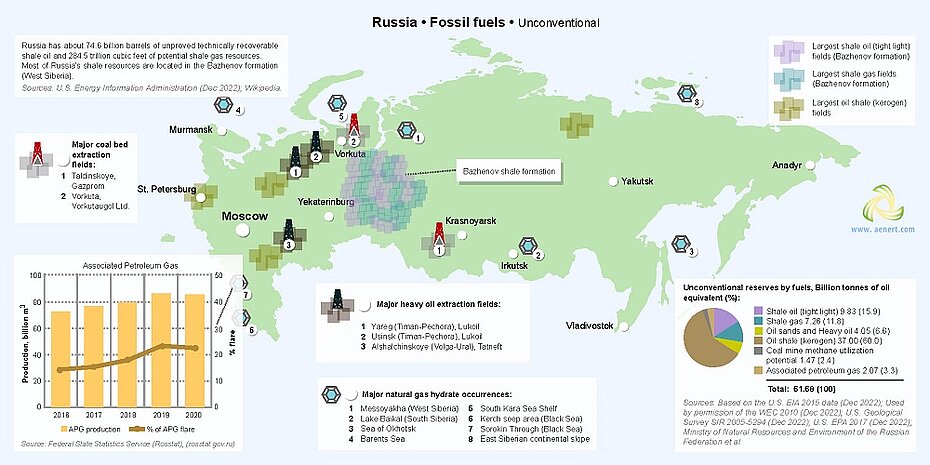
Figure 7. Basic infrastructure facilities of the fossil fuel sector in Russia: unconventional resources (click on the map to view a PDF version)
In the total potential of unconventional resources, the share of kerogen oil is 59.7%, light constrained oil accounts for 15.9%, shale gas for 11.7%, oil sands and heavy oil for 6.5%, associated petroleum gas for 3.3%, and mine methane utilization potential for 2.9% (Fig.7).
Yaregskoye (Timan-Pechora) oil field is a large heavy oil field, which is being developed by Lukoil; according to [38], the field may contain 318 million barrels of recoverable reserves, with production at the level of 10,000 barrels per day. In the 1960s, natural gas hydrates were discovered in Russia during the development of the Messoyakhskoye field in Western Siberia, and in the 1970s, hydrate deposits were discovered at the bottom of the Black Sea. To date, gas hydrates have been identified at the bottom of Lake Baikal, the Caspian, Black and Okhotsk seas, as well as at the Yamburgskoye, Bovanenkovskoye, Urengoyskoye fields. According to Gazprom VNIIGAZ, the potential of gas hydrates in Russia is 1,100 trillion m³. In 2013, Rosneft considered the possibility of studying the production of gas hydrates on the Kuril shelf, the potential of which is 87 trillion m³ [39]. As of 2013 there were no corresponding programs for the study and production of gas hydrates in Russia. The development of this resource, according to [39], appears to be possible in Russia only after a significant reduction in the cost of production technology and in areas with an already existing gas infrastructure.
Russia is one of the world leaders in coalbed methane reserves. According to Gazprom, methane resources in the main coal basins of Russia are estimated at 83.7 trillion cubic meters, which corresponds to about a third of the country's predicted natural gas resources [40]. The largest field is the Taldinskoye field, the development of which began in 2010; its reserves were estimated at 74.2 billion cubic meters. In 2014, 2.8 million cubic meters of gas was produced; in total, 16 million cubic meters have been produced since the start of operation [40]. The greatest prospects for the production of light tight oil and shale gas in Russia are found at the Bazhenov formation which, according to experts, may contain anywhere from 2-3 to 170 billion tons of oil. Most geologists cite a compromise figure of 20 billion tons of oil; however, according to the Oil and Gas Journal Russia, the proven reserves of the formation are estimated at tens of millions of tons [41].
According to the U.S. Energy Information Administration, technically recoverable shale gas reserves at the Bazhenov formation are estimated at 285 Tcf, and light constrained oil at 74.6 billion barrels [42]. The source [43] estimates the state of development of the field at 10 million tons of cumulative oil production as of June 2017, but it also notes that the use of current technologies is inefficient.
The main coal deposits in Russia are the Kansk-Achinsky and Kuznetsk coal basins, the reserves of which in 2019, under the A + B + C1 categories, were 79.3 billion tons and 55.5 billion tons, respectively, with the maximum production level in the Kuznetsk coal basin at 222.4 million tons in 2018 [9]. Coal is exported through four large export terminals, the main facility being the fully automated Vostochny, which in 2016 had a throughput of around 23.5 million tons [44].
A map showing the territorial distribution of the largest infrastructure facilities in Russia for the production of electricity is shown in Figure 8.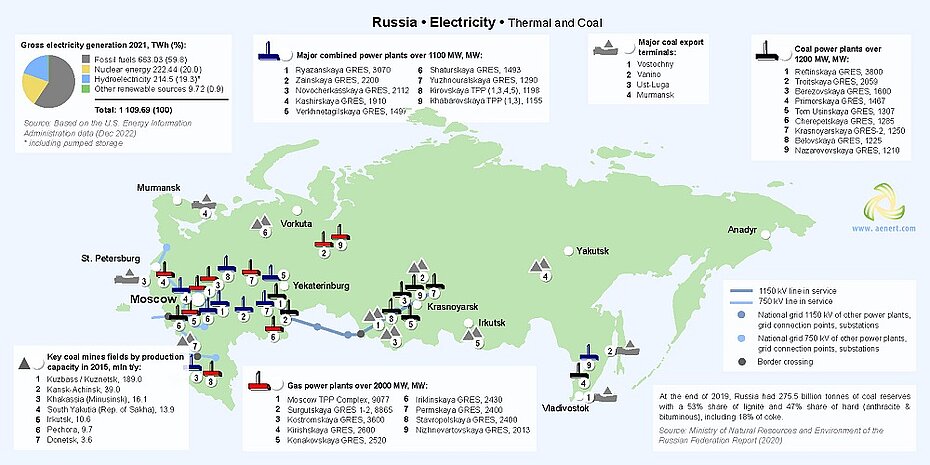
Figure 8. Electricity production in Russia: thermal power plants (click on the map to view a PDF version)
As already noted, the share of fossil resources in the production of electricity in Russia in 2018 amounted to more than 64% (Fig. 8). The country has a significant number of plants for the production of electricity from hydrocarbons, including nine coal-fired plants with a capacity of over 1200 MW, nine gas stations with a capacity of over 2000 MW, and nine combined-type power plants with a capacity of over 1100 MW (Fig. 8). The largest generation facilities in Russia are: for gas – Moscow TPP Complex with a total capacity of 9,077 MW [45]; coal – Reftinskaya GRES, with an installed capacity of 3,800 MW; combined type – Ryazanskaya GRES with a capacity of 3,130 MW [46,47].
Hydropower, along with nuclear power, has a significant share in electricity production in Russia. Hydroelectric power plants and pumped storage power plants generated around 187 TWh of electricity in 2018 (Fig. 9).
Figure 9. Electricity production of in Russia: Hydro, Geothermal, Tidal, Bioenergy (click on the map to view a PDF version)
In 2018, according to the Federal State Statistics Service, the installed capacity of hydroelectric power plants in Russia was 51.3 GW, which produced 193 TWh of electricity [48]. In 2019, the total capacity of small hydropower plants with an installed capacity of less than 30 MW was 826.5 MW [49]. The largest hydroelectric power plant is Sayano-Shushenskaya with an installed capacity of 6,400 MW [50]; the largest pumped storage power plant is Zagorskaya, with an installed capacity of 1,200 MW [51].
Nuclear power is represented by 10 nuclear power plants, most of which are concentrated in the west of the country (Fig. 6). Four of ten stations have an installed capacity of 4,000 MW – Balakovo, Kalinin, Kursk and Leningrad [52,53,54,55]. The Priargunsky mine (Krasnokamensk) uranium deposit is one of the 10 largest deposits in the world with estimated reserves of 71.9 million tons of ore [56]. Several lithium deposits have also been discovered in Russia, the largest of which is Zavitinsky in the Chita region (Fig. 9).
Renewable energy in Russia, with the exception of hydropower, does not have a significant share in electricity production. The total production of electricity from renewable sources in 2018, excluding hydropower, was 1,006 GWh. Wind farms have been installed in several coastal regions, in areas of relatively high wind activity, among which there are four relatively large wind farms with a capacity of more than 1 MW each. In 2018, 11 wind farms were registered in Russia with a total installed capacity of 17 MW (excluding the territory of Crimea) [57]. The largest of these is Kulikovo (Zelenogradsk) Wind Farm with an installed capacity of 5.1 MW [58]. The level of scattered solar radiation in certain regions of the country has stable values of 3.5 kWh/m²/day, which is low but sufficient enough for the production of energy through photovoltaics [16]. As a result, there solar energy facilities are located on this territory, including 11 photovoltaic plants with a capacity of more than 10 MW each (excluding the territory of Crimea). The largest is Sakmarskaya, put into operation in 2015, with an installed capacity of 25 MW [59]. As noted above, Russia has a fairly high potential for geothermal resources, but its share in the production of electricity from renewable sources is extremely small at 426 TW/hour in 2018. In the east of the country there are several single flash geothermal stations, the largest of which is Mutnovskaya with a capacity of 50 MW [60]. In the north-west of the country, in the Murmansk region, the Kislaya Guba tidal station is in operation, with an installed capacity of 1.7 MW [61].
Bioenergy is developing relatively slowly in Russia, and as of 2018 only about 73 GWh of electricity was generated from biomass. The country has facilities for the processing of biomass and municipal waste, the production of biogas, bioethanol and pellets.
In Russia, several power plants use biomass as feedstock; the largest is Sharinskaya with an installed capacity of 24 MW, which uses peat as its main fuel [62]. The Miranda Company plans to produce about 200 tons of bioethanol daily from corn, at a plant in Vladikavkaz [63]. Though there are far fewer biogas plants in Russia than, for example, in European countries, a notable facility is the biogas power plant in Romodanovo, which has an installed capacity of 4.4 MW [64]. In terms of generating electricity from municipal and industrial waste, Russia lags far behind the leading countries in this area - the United States, China, Germany and Japan. The country has a complex of municipal waste processing stations - Moscow MSW 2 and 4 – capable of producing up to 12.4 MW of electricity [65, 66]. In recent years, Russia has taken active measures to increase its capacity for utilizing municipal waste, including a program for the separate collection of waste and its subsequent incineration by environmentally-sound methods. A significant number of facilities for the production of pellets operate in Russia, including 10 plants with a capacity of over 20,000 tons per year. The leading facility is Vyborgskaya Forest Corporation Wood Pellet Plant in the Leningrad Region, with an installed capacity of 1,000,000 tons of pellets per year, but it is not operating at full potential [67].
The principle aim of the “Energy Strategy of Russia for the Period up to 2035” is the transition of the country's energy sector to a higher, qualitatively new level [68], and to achieve this, the following objectives have been set: to reduce energy intensity by 1.6 times, and electrical intensity by 1.4 times; an increase in the share of hydrocarbons produced using secondary and tertiary methods with an increase in recovery factors, including from unconventional resources; diversification of energy exports with a significant increase in the market share of the APR countries (increasing the share of oil and oil products from 12% to 23% [crude oil - 32%], and gas exports from 6 to 31%); increasing investment in the development and use of non-traditional renewable energy sources; a reduction of specific indicators of environmental pollution.
The Russian energy complex plans to increase the depth of oil refining to 90%; to increase the share of natural and associated gas in the production of primary resources from 41% to 47%; to maintain the share of solid fuel at the level of 11-12%; to develop the electric power industry with an increase in the installed capacity of power plants by more than 33%; and to increase electricity generation by 1.6 times [69]. Another important aspect is improving the reliability of energy supply and expanding the range of energy services provided to the population. The strategy involves reaching, by 2035, the level of retail prices for electricity, natural gas and oil products commensurate with those in the United States (it is assumed that the average selling price of electricity for end consumers is limited to 9-10 US cents (in constant 2010 prices) for 1 kWh) [69]. The list of innovative energy projects in Russia is extensive, but the leading ones are projects related to the expansion of the country's export opportunities. Thus, one of the largest completed projects is the construction of the 3,000 km Power of Siberia gas pipeline, which can transport around 38 billion m³ of gas from fields in Eastern Siberia to China annually [70]. The construction of the largest gas processing plant in Russia is currently underway, which will process gas coming from the aforementioned fields in the Amur Region, with a design capacity of 42 billion m³ per year. The plant will also host the world's largest helium production facility with an installed capacity of 60 million m³ per year [71]. The second largest project is the expansion of the Sakhalin-Khabarovsk-Vladivostok pipeline, which is necessary to ensure gas supplies for the Eastern Petrochemical Company (VNHK; Rosneft project), as well as for the mineral fertilizer plant in Nakhodka [72].
In Pevek, the northernmost Russian city, the construction of the world's first floating nuclear power plant "Akademik Lomonosov" has been completed. The station began operation in 2019, and has an installed capacity of 70 MW [73,74]. Also noteworthy in the field of nuclear power is the Proryv pilot demonstration power complex in the Tomsk region, with a fundamentally new reactor design – BREST-300 – based on a closed nuclear fuel cycle using fast neutron reactors with a lead coolant, which should increase radiation safety in the region [75]. The construction of the BREST-OD-300 power unit is planned to be completed in 2026 [76]. In the field of thermal energy, the most ambitious project is the modernization of the power system of the Kaliningrad region, which involves the construction of three gas-fired power plants – Pregolskaya (440 MW), Mayakovskaya (156 MW) and Talakhovskaya (156 MW) – one coal plant – Primorskaya (150 MW), and the modernization and construction of new power transmission lines [77,78]. Separately, it is worth noting the construction of the Grozny open-cycle gas turbine power plant, with two 180 MW turbines with the possibility of further expansion. The cost of the project is estimated at 25-26 billion rubles, and the first power unit was commissioned in 2018 [79,80]. One of the largest petrochemical projects in Russia since 1991 is the ZapSibNeftekhim plant under construction in Tobolsk, which is capable of producing 1.5 million tons of ethylene, 500 thousand tons of propylene, 1.5 million tons of polyethylene and 500 thousand of polypropylene per year [81,82]. Of particular importance for the industry is the expansion of the TANECO complex of oil refineries and petrochemical plants in Nizhnekamsk, which should increase the degree of processing of high-sulphur heavy oil produced in Tatarstan. In 2014, the enterprise launched a hydrocracking unit, the design capacity of which is 2.9 million Euro-5 diesel fuel per year [83].
The Yamal LNG project, a joint venture between Novatek, Total, and CNPC, is being implemented at the Yuzhno-Tambeyskoye field, where there are reserves of 926 billion cubic meters of gas. The construction of the plant, with a capacity of 16.5 million tons/year, is to be carried out in three stages with launches in 2017, 2018 and 2019 [84].
Education and Innovation
A set of indicators reflecting Russia's position relative to other countries in the field of education and innovation can be seen in Figure 12. The diagram shows that the country has a fairly high level of academic achievement. According to the Global Innovation Index in 2019, Russia is ranked 46th out of 126 countries considered. In terms of the number of patents issued to Russian nationals, both domestically and abroad, the country ranks 7th in the world. Likewise, the country ranks 8th in the world in terms of the number of valid patents, outlining Russia’s favorable conditions for innovation.
Sources: 1. The Global Innovation Index 2021, Rankings / Knowledge / World Intellectual Property Organization / Cornell University, INSEAD, and WIPO (2021): Energizing the World with Innovation. Ithaca, Fontainebleau, and Geneva *132 2. Patent Grants 2011-2020, resident & abroad / Statistical country profiles / World Intellectual Property Organization *185 3.Patents in Force 2020 / Statistical country profiles / World Intellectual Property Organization *109 4. QS World University Rankings 2022 *97 5. SCImago Country Rankings (1996-2020) / Country rankings / SCImago, (n.d.). SIR-SCImago Journal & Country Rank [Portal]. Retrieved 17 Nov 2021 *240 6. Internet users in 2018 / The World Factbook / Central Intelligence Agency *229 7. Internet users in 2018 (% Population) / The World Factbook / Central Intelligence Agency *229 8. Government expenditure on education, total (% of GDP), 2019 / United Nations Educational, Scientific, and Cultural Organization (UNESCO) Institute for Statistics. License: CCBY-4.0 / Data as of September 2021*177 9. Research and development expenditure (% of GDP), 2018 / UNESCO Institute for Statistics. License: CCBY-4.0 / Data *119 10. Scientific and technical journal articles, 2018 / National Science Foundation, Science and Engineering Indicators. License: CCBY-4.0 / Data *197 * Total number of countries participating in ranking | ||
| Figure 8. The indices of education and innovation in Russia |
Russia’s public spending on education, as a percentage of the country's GDP, is below the world average - 114th out of 169 countries selected for consideration; data on private investment in education and research are not included. Nevertheless, 27 Russian universities are included in the QS University Rating of the world's leading universities. It is also worth noting that the country's GDP is quite high; therefore, in absolute terms the costs of education and research are considerable.
According to The World Bank, in 2015 Russia placed 31st in terms of public spending on research and development, as a percentage of GDP. The high level of research activity in the country is also indicated by the indices assessing the number of publications by Russian specialists in scientific and technological journals. In the Scimago ranking, the country ranks 12th out of 224 participating countries (as of August 2018), and in the Scientific and Technical Journal Activities ranking, Russia is 7th out of 196 countries (2016), behind, for example, Great Britain and Japan. The country is also among the leaders in the region in terms of the number of Internet users.
The leading higher educational institutions in Russia - Lomonosov Moscow State University, Bauman Moscow State Technical University, Gubkin Russian State University of Oil and Gas, National University of Science and Technology “MISiS”, National Research Nuclear University MEPhI - train specialists in various fields energy, including Thermal and Heat Engineering, Power and Electrical Engineering, Energy Engineering, Materials Science and Engineering, Mechanical Engineering, and Metallurg, etc.
In the sector of technologies for the production of synthetic fuels, Rosneft, Gazprom Promgaz, Gazochim Techno LLC actively patent their inventions. Research in this area is carried out by RAS A.V. Topchiev Institute of Petrochemical Synthesis, Lomonosov Moscow State University, Kazan National Research Technological University, RAS SB Boreskov Institute of Catalysis.
In the field of unconventional oil production and processing, Tatneft, RAS SB Institute of Petroleum Chemistry holds patents for inventions. Kazan Federal University, Ufa State Petroleum Technological University, Tatneft actively publish research articles in this area.
Gazprom Promgas, RAS IPKON, Georesonance Ltd lead in the number of patents in the field of technologies for the utilization of coal bed methane; the leaders by number of publications are the National University of Science and Technology “MISiS”, RAS SB Chinakal Institute of Mining, Kuzbass State Technical University, SUEK-Kuzbass. The leaders among Russian companies in exploration and production of gas hydrates are Gazprom Promgaz, Gazprom VNIIGAZ; and among research organizations - Lomonosov Moscow State University, Gubkin Russian State University of Oil and Gas, VNIIOkeangeologia. Tatneft, Gazprom Tekhno, Sintop and GTL are leading in the field of technologies for the production and utilization of associated petroleum gas in terms of the number of patents; research in these areas is carried out by Ufa State Petroleum Technological University, Gubkin Russian State University of Oil and Gas, Tyumen State Oil and Gas University, Tomsk Polytechnic University.
Notable patent holders in the field of hydrocarbon production from reservoirs with low permeability are Tatneft, Rosneft, and research is carried out by Ufa State Petroleum Technological University, RAS SB Chinakal Institute of Mining and Gubkin Russian State University of Oil and Gas.
A large number of organizations patent inventions and conduct research in the field of technologies for the production of energy from renewable sources. In the field of solar energy, the Institute for Electrification of Agriculture (VIESH), RAS Ioffe Physical Technical Institute, Ministry of Industry and Trade of the Russian Federation feature prominently. Among universities, the Institute for Electrification of Agriculture (VIESH), RAS Ioffe Physical Technical Institute, Bauman Moscow State Technical University, Bashkir State University are leading in the number of publications in this area.
In the field of wind energy, Voronezh State University, Ansaat are among the leaders in terms of the number of patents, and research is carried out by Stavropol State Agrarian University, Lomonosov Moscow State University, Novosibirsk State Technical University. Innovation in the field of bioenergy is conducted by the Institute for Electrification of Agriculture (VIESH), and research is carried out by Lomonosov Moscow State University, RAS SB Boreskov Institute of Catalysis, RAS A.V. Topchiev Institute of Petrochemical Synthesis.
Ecology and Environment Protection
The diagram of environmental indices, which is presented in Figure 13, makes it possible to assess, to some degree, the environmental situation in the country, which in Russia is rather negative. It is necessary to note the rather high level of CO2 emissions in Russia, both in general and per capita, as well as the high level of methane emissions.
| Sources: 1. CO2 total emission by countries 2020 / European Commission / Joint Research Centre (JRC) / Emission Database for Global Atmospheric Research (EDGAR)*208 2. CO2 per capita emission 2020/European Commission/Joint Research Centre (JRC) / Emission Database for Global Atmospheric Research (EDGAR) *208 3. Forest area 2020 (% of land area) / The Global Forest Resources Assessment 2020 / Food and Agriculture Organization of the United Nations *234 4. Forest area change 2010-2020 (1000 ha/year) / The Global Forest Resources Assessment 2020 / Food and Agriculture Organization of the United Nations *234 5. The Environmental Performance Index (EPI) 2020 / Rankings / Yale Center for Environmental Law & Policy / Yale University *180 6. Annual freshwater withdrawals (m3 per capita), 2017 *179 Annual freshwater withdrawals, total (billion m3), 2017 – Food and Agriculture Organization, AQUASTAT data. /License: CC BY-4.0; Population – United Nations, Department of Economic and Social Affairs, Population Division (2019). World Population Prospects 2019, custom data acquired via website. Retrieved 15 November 2021 7. The National Footprint Accounts 2017 (Biocapacity Credit / Deficit) / Global Footprint Network *188 8. Methane emissions (kt of CO2 equivalent), 2018 / Data for up to 1990 are sourced from Carbon Dioxide Information Analysis Center, Environmental Sciences Division, Oak Ridge National Laboratory, Tennessee, United States. Data from 1990 are CAIT data: Climate Watch. 2020. GHG Emissions. Washington, DC: World Resources Institute. Available at: License : Attribution-NonCommercial 4.0 International (CC BY-NC 4.0) *191 9. The Climate Change Performance Index (CCPI) 2022 / Overall Results / Jan Burck, Thea Uhlich, Christoph Bals, Niklas Höhne, Leonardo Nascimento / Germanwatch, NewClimate Institute & Climate Action Network *60 * Total number of countries participating in ranking | ||
| Figure 9. Environmental Indices of Russia |
Russia was ranked 53rd in the 2018 Climate Change Performance Index (CCPI), which includes the 61 countries responsible for more than 90% of global energy-related CO2 emissions (i.e. among the countries with the least negative impact of those selected for consideration). Russia is one of only three countries in the CCPI ranking that has a declining share of renewable energy in total energy production, owing to a decrease in electricity production from large hydropower plants [86].
When comparing forest area to the total area of the country, Russia is in 57th place in the world. In terms of trends related to its change, the country is in 201st place in the world, at the bottom of the ranking.
Nevertheless, the country received a relatively high assessment from the Environmental Performance Index 2018 (EPI), which is focused primarily on the environmental activities of national governments aimed at reducing the negative impact of the environment, and on the rational use of natural resources. In this rating, the country is in 52nd place, out of 180 participating countries.
However, according to The Environmental Vulnerability Index, based on long-term observations of 50 indicators, including, for example, water quality, waste production and processing, the country is in 71st place out of 234 countries, and belongs to the category of “vulnerable” countries. The overall negative picture is brightened by the fact that according to the Ecological Footprint Atlas, Russia is one of the environmental lenders.
References
[1] List of sovereign states and dependencies by area / Wikipedia / en.wikipedia.org/wiki/List_of_sovereign_states_and_dependencies_by_area
[2] List of countries and territories by population density / Wikipedia / en.wikipedia.org/wiki/List_of_countries_and_territories_by_population_density
[3] Russia / The World Factbook / Central Intelligence Agency / www.cia.gov
[4] GDP, PPP (current international $) / The World Bank / data.worldbank.org
[5] GDP per capita, PPP (current international $) / The World Bank / data.worldbank.org
[6] International Energy Statistic / Geography / U.S. Energy Information Administration / www.eia.gov/beta/international/
[7] BP Statistical Review of World Energy June 2020 / BP / www.bp.com
[8] World Energy Council Coal Resources 2016 (PDF) / World Energy Council / www.worldenergy.org
[9] Государственный доклад «О состоянии и использовании минерально-сырьевых ресурсов Российской Федерации в 2018 году» / Министерство Природных Ресурсов и Экологии Российской Федерации / www.mnr.gov.ru
[10] World Shale Resource Assessments / U.S. Energy Information Administration, September 24, 2015 / www.eia.gov
[11] Survey of Energy Resources 2010 / World Energy Council / www.worldenergy.org
[12] 2006 IPCC Guidelines for National Greenhouse Gas Inventories, Volume 2, Energy, Fugitive Emissions (PDF) / The Intergovernmental Panel on Climate Change (IPCC) / www.ipcc-nggip.iges.or.jp
[13] Conventional Oil & Gas, CBM and Shale Gas. Oil Opportunities in India (PDF) / World Petrocoal / worldpetrocoal.com
[14] Energiestudie 2016 (PDF) / Federal Institute for Geosciences and Natural Resources (BGR) / www.bgr.bund.de
[15] Netraditsionnye resursy uglevodorodnogo syrya / Gubkin Russian State University of Oil and Gas (National Research University), Bessel V. V. / www.gubkin.ru
[16] Solar resource data obtained from the Global Solar Atlas, owned by the World Bank Group and provided by Solargis / Global Solar Athlas / globalsolaratlas.info/map
[17] Wind Map / Global Wind Atlas 2.0, a free, web-based application developed, owned and operated by the Technical University of Denmark (DTU) in partnership with the World Bank Group, utilizing data provided by Vortex, with funding provided by the Energy Sector Management Assistance Program (ESMAP). For additional information: globalwindatlas.info
[18] World Energy Resources Hydropower 2016 / World Energy Council / www.worldenergy.org
[19] Russia / Country Profiles / International Hydropower Association / www.hydropower.org
[20] Agricultural land (% of land area) /Food and Agriculture Organization, electronic files and web site. License: CC BY-4.0 / Data / The World Bank / www.worldbank.org
[21] Forest area (% of land area) /Food and Agriculture Organization, electronic files and web site. License : CC BY-4.0 / Data / The World Bank / www.worldbank.org
[22] 2016 Annual U.S. & Global Geothermal Power Production Report (PDF)/ Geothermal Energy Association / www.geothermal-energy.org
[23] Геотермальная энергетика России / Государственная информационная система в области энергосбережения и повышения энергетической эффективности / gisee.ru
[24] What a Waste 2012 (PDF) / Resources / The World Bank / www.worldbank.org
[25] Russia / Energy Information Administration / www.eia.gov
[26] Экспорт Российской Федерации сырой нефти за 2000-2017 годы / Центральный Банк РФ / www.google.at
[27] Россия может сократить экспорт нефти в 2020 году / Ведомости, 17 января 2020 года / Елена Вавина / www.vedomosti.ru
[28] Добыча и использование нефтяного (попутного) газа / Российский статистический ежегодник 2019 / gks.ru
[29] Производство электрической энергии (PDF)/ Минэнерго / minenergo.gov.ru
[30] Country Analysis Brief: Russia (PDF) / U.S. Energy Information Administration, October 31, 2017 / www.eia.gov
[31] Годовой отчёт Башнефть за 2019 год (PDF) / Башнефть / www.bashneft.com / www.bashneft.com
[32] Novorossiysk Fuel Oil Terminal / Wikipedia / en.wikipedia.org/wiki/Novorossiysk_Fuel_Oil_Terminal
[33] Processing / Gazprom / www.gazprom.com
[34] UGS facilities in Russia / Gazprom / www.gazprom.com
[35] Transsakhalin pipeline system / Sakhalin Energy / www.sakhalinenergy.ru/en/
[36] Kalingrad Floating LNG Terminal / A Barell Full / abarrelfull.wikidot.com
[37] Регазификационный терминал СПГ в Калининградской области / Gazprom / www.gazprom.ru
[38] Yaregskoye oil field / Wikipedia / en.wikipedia.org/wiki/Yaregskoye_oil_field
[39] Газогидраты: технологии добычи и перспективы разработки (PDF) / Аналитический центр при Правительстве Российской Федерации / ac.gov.ru
[40] О перспективах добычи в России угольного газа / Газпром / www.gazprom.ru
[41] Перспективы добычи в условиях санкций и падения цен на нефть / Oil and Gas Journal Russia / ogjrussia.com
[42] Technically Recoverable Shale Oil and Shale Gas Resources: An Assessment of 137 Shale Formations in 41 countries outside the United States (PDF) / U.S. Energy Information Administration (EIA) / www.eia.gov
[43] Россия приступает к самым богатым залежам сланцевой нефти в мире / Коммерсант / www.kommersant.ru
[44] Vostochny Port (company) / Wikipedia / en.wikipedia.org/wiki/Vostochny_Port_(company)
[45] Mosenergo / Wikipedia / en.wikipedia.org/wiki/Mosenergo
[46] Reftinskaya GRES / Wikipedia / en.wikipedia.org/wiki/Reftinskaya_GRES
[47] Ryazan Power Station / Wikipedia / en.wikipedia.org/wiki/Ryazan_Power_Station
[48] Производство и распределение электроэнергии, газа и воды / Федеральная Служба Государственной Статистики / gks.ru
[49] World Small Hydropower Development Report 2019 (PDF) / United Nations Industrial Development Organization (UNIDO) / www.unido.org
[50] Sayano-Shushenskaya Branch / RusHydro / www.sshges.rushydro.ru
[51] Zagorsk Pumped Storage Station / Wikipedia / en.wikipedia.org/wiki/Zagorsk_Pumped_Storage_Station
[52] Balakovo Nuclear Power Plant / Wikipedia / en.wikipedia.org/wiki/Balakovo_Nuclear_Power_Plant
[53] Kalinin Nuclear Power Plant / Wikipedia / en.wikipedia.org/wiki/Kalinin_Nuclear_Power_Plant
[54] Kursk Nuclear Power Plant / Wikipedia / en.wikipedia.org/wiki/Kursk_Nuclear_Power_Plant
[55] Leningrad Nuclear Power Plant / Wikipedia / en.wikipedia.org/wiki/Leningrad_Nuclear_Power_Plant
[56] Priargunsky_mine / Wikipedia / en.wikipedia.org/wiki/Priargunsky_mine
[57] Ветроэнергетика России / Wikipedia / ru.wikipedia.org/wiki/%D0%92%D0%B5%D1%82%D1%80%D0%BE%D1%8D%D0%BD%D0%B5%D1%80%D0%B3%D0%B5%D1%82%D0%B8%D0%BA%D0%B0_%D0%A0%D0%BE%D1%81%D1%81%D0%B8%D0%B8
[58] Kulikovo (Zelenogradsk) Wind Farm / Wikipedia / en.wikipedia.org / ru.wikipedia.org/wiki/%D0%97%D0%B5%D0%BB%D0%B5%D0%BD%D0%BE%D0%B3%D1%80%D0%B0%D0%B4%D1%81%D0%BA%D0%B0%D1%8F_%D0%B2%D0%B5%D1%82%D1%80%D0%BE%D1%8D%D0%BD%D0%B5%D1%80%D0%B3%D0%BE%D1%83%D1%81%D1%82%D0%B0%D0%BD%D0%BE%D0%B2%D0%BA%D0%B0
[59] Альтернативные источники энергии, входящие в ЕЭС России / Альтернативные источники энергии, входящие в ЕЭС России / 23/12/2016 / nauka-rastudent.ru/36/3850/
[60] RusHydro / www.eng.rushydro.ru / www.eng.rushydro.ru/company_geography/
[61] Kislaya Guba Tidal Power Station / Wikipedia / en.wikipedia.org/wiki/Kislaya_Guba_Tidal_Power_Station
[62] Торф пустят в регионы / Газета "Коммерсантъ" №30 от 24.02.2016, стр. 9 / www.kommersant.ru
[63] Стартовали на биотопливе: В Северной Осетии реализуют уникадьные промышленные проекты" / RG.RU (Rossiyskaya Gazeta) / www.rg.ru
[64] Коровы против Газпрома / Деловая газета "Взгляд", 13 августа 2012 / vz.ru
[65] 130 000 tpy MSW Thermal Treatment Plant 2, Moscow / Waste to Energy International / wteinternational.com
[66] 250 000 tpy MSW Thermal Treatment Plant No4, Moscow / Waste to Energy International / wteinternational.com
[67] The development of the pellet production and trade in Russia, 2012 /Information and Analytical Agency "Infobio" / www.infobio.ru/en
[68] Проект энергостратегии российской федерации на период до 2035 года (редакция от 09.06.2020) / Министерство Энергетики Российской Федерации / minenergo.gov.ru/node/1026
[69] Основные положения проекта энергетической стратегии россии на период до 2035 года / Министерство Энергетики Российской Федерации / minenergo.gov.ru
[70] «Сила Сибири» / Газпром / www.gazprom.ru
[71] Амурский газоперерабатывающий завод / Газпром / www.gazprom.ru
[72] «Стройтранснефтегаз» пройдет без конкурса / РБК, 19 АПР 2017 / www.rbc.ru
[73] Росэнергоатом: в самом северном городе России - Певеке началось сооружение береговой инфраструктуры для первой в мире плавучей АЭС / Росатом / www.rosatom.ru
[74] Тепло и свет придут с воды. Завершается строительство плавучей атомной электростанции / Российская Газета, 2017/06/27 / rg.ru
[75] Проект прорыв / proryv2020.ru
[76] Постройку в России ядерного реактора БРЕСТ могут начать в конце 2017 года / Риа новости, 18.01.2017 / ria.ru/atomtec
[77] Россети выделили Янтарьэнерго дополнительное финансирование на модернизацию энергосистемы Калининградской области/ Нефтегаз, 4 июля 2017 / neftegaz.ru
[78] Строительство Приморской ТЭС 150 МВт / Energy Base / energybase.ru
[79] В "Газпроме" оценили инвестиции в строительство Грозненской ТЭС / РИА Новости, 01.03.2017 / ria.ru
[80] Грозненская ТЭС / ОГК-2 / www.ogk2.ru/rus/branch/groznenskaya/
[81] ЗапСибНефтехим/ Сибур / www.sibur.ru/zsn/
[82] ЗапСибНефтехим / Википедия / ru.wikipedia.org/wiki/%D0%97%D0%B0%D0%BF%D0%A1%D0%B8%D0%B1%D0%9D%D0%B5%D1%84%D1%82%D0%B5%D1%85%D0%B8%D0%BC
[83] Обзор новых производств / Сделано у нас / sdelanounas.ru/blogs/48400/
[84] Ямал СПГ / yamallng.ru/project/about/
[85] The Climate Change Performance Index Results 2018 (PDF) / Germanwatch/ germanwatch.org/en/
The sources of charts and curves are specified under the images.
For more information about the energy industry in Russia see here