
Contents
General State of the Economy
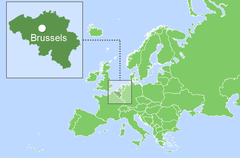
Belgium, officially the Kingdom of Belgium, is a state in Western Europe. Its capital city is Brussels. The country borders the Netherlands (to the north), Germany (to the east), Luxembourg (to the south-east), France (to the south-west). In the north-west the country has access to the North Sea. According to 2022 statistics, Belgium, which in terms of size is placed 140th in the world, is home to around 11.8 million people. In terms of population density, the country ranks 34th in the world out of the 248 countries considered [1,2,3]. The total length of the country's coastline is 66.5 km [3]. The political form of government is a federal parliamentary constitutional monarchy, and the official languages are Dutch, French and German. The administrative map of the country is divided into 3 regions [3].
Belgium, a member of the European Union, has a balanced modern market economy, which is reflected in Figure 1. For six of the shown indices, the kingdom positions higher than the world average, in the top quarter of the graph (i.e. among the top 25% of the countries included in the rating).
| Sources: 1. GDP (purchasing power parity), 2020 est. / The World Factbook/Library/Central Intelligence Agency *228 2. GDP - per capita (PPP), 2020 / The World Factbook/Library/Central Intelligence Agency *229 3. Inflation rate (consumer prices), 2019 est. / The World Factbook/Library/Central Intelligence Agency *228 4. Charges for the use of intellectual property, receipts (BoP, current US$), 2020 / International Monetary Fund, Balance of Payments Statistics Yearbook, and data files. / License: CC BY-4.0 *88 5. The Global Competitiveness Index 2019 / Rankings / Reports / World Economic Forum *141 6. High-technology exports (current US$) 2019-2020 / United Nations, Comtrade database through the WITS platform / License: CCBY-4.0 / Data *134 7. 2021 Index of Economic Freedom / International Economies / The Heritage Foundation *178 8. Reserves of foreign exchange and gold, 2017 est. / The World Factbook / Library / Central Intelligence Agency *195 9. Annual average GDP growth in %, for the last 10 years (2011-2020) / World Bank national accounts data, and OECD National Accounts data files / License: CC BY-4.0 *206 10. Public debt (% of GDP), 2017 est. / The World Factbook / Library / Central Intelligence Agency (from smallest to largest) *210 * Total number of countries participating in ranking Figure 1. Economic Indices of Belgium |
The inflation rate indicator, however, demonstrates a result slightly below the world average.
Since the early 1990s, the country has experienced a steady growth in GDP at purchasing power parity, both in general and per capita [4,5]. GDP at purchasing power parity increased from $513 billion in 2015 to $557.1 billion (36th in the world) in 2020 2017 [3]. The country’s GDP at purchasing power parity per capita is somewhat higher (31st in 2020), and has also been demonstrating positive dynamics: from $46 600 in 2017 to $48 200 in 2020 [3]. The inflation rate grew from 2.1% in 2017 to 1.4% in 2019; Belgium ranks 82nd out of 227 countries for this indicator from a smaller to a larger value, which however, does not always unambiguously characterize the state of the economy [3].
According to The Global Competitiveness Report 2019, presented by the World Economic Forum, Belgium ranks 22nd out of a total of 141 countries considered; behind the Netherlands and Luxemburg, but ahead of France. This rating reflects the effectiveness of the use of the country’s own resources for sustainable development. In addition to a number of economic indicators this index also takes into account such variables as education, health, level of innovation, etc.
In the list of countries that exported high-tech products in 2019-2020, the country placed 17th out of 134 countries, ahead of the world average. According to the Index of Economic Freedom, which is based on freedom of business, freedom from government intervention, property protection, and freedom from corruption, Belgium was 37th in 2021 out of the 178 countries considered. In terms of gold reserves and foreign exchange reserves in 2017 the kingdom was 54th in the world, behind a number of European countries. According to the indicator for the average GDP growth in percentage over the last 10 years, in 2020 the country was 166th out of 206 countries. In terms of public debt, calculated as a percentage of the country's GDP, Belgium was ranked 13th out of 210 countries considered in 2017.
Energy Resources
In Belgium, there are practically no significant fossil fuel reserves. According to U.S. Energy Information Administration, primary energy production in Belgium accounts for 25.64% of total energy consumption in 2021 (Fig. 5).
In the absence of conventional reserves, Belgium has significant renewable resources for energy production, including a high potential for wind energy utilization. A selection of basic indicators of this type of resource is presented in Table 1.
Table 1. Renewable energy resources of Belgium
| Resource/ Explanations | Solar Potential (GHI)* | Wind Potential (50 м)* | Hydro energy Potential** | Bio Potential (agricultural area) | Bio Potential (forest area) | Geothermal Potential | Municipal Solid Waste |
|---|---|---|---|---|---|---|---|
| Value | 2.7-3.0 | <5 | 1 | 45.1 | 22.8 | 82 | 746 |
| Unit | kWh/m2/day | m/s | TWh/year | % of land area | % of land area | MWe | kg per capita |
| Year | 2018 | 2018 | 2008 | 2020 | 2020 | 2015 | 2020 |
| Source | [6] | [7] | [8] | [9] | [10] | [11] | [12] |
*for the majority of the territory of the country
**gross theoretical capability
The level of global horizontal radiation in the majority of the country is between 2.7-3.0 kWh/m2/day [6]. In the country’s west and southeast regions, and in the coastal areas of the North Sea this indicator can be over 3.0 kWh/m2/day [6].
The distribution of wind resources is as follows: in most of the country the wind speed is < 5 m/s [7]; however along the coastline with the North Sea, wind speed can be over 6.5 m/s, and in the coastal areas of the North Sea this indicator can reach more than 9.6 m/s at a height of 90 meters.
The gross theoretical capability of hydro power in the country is only 1 TW/year, which is insignificant compared to, for example, France and Germany, where the theoretical potential is 270 and 120 TW/year, respectively [8]. In 2020, about 45.1% of Belgium was covered by agricultural land [9]. This area is decreasing, however the country is experiencing a slight increase in forested area, which covered 22.8% of the country in 2020, compared to 22% in 2000 [10]. In 2008 the potential of geothermal resources of Belgium was 82 MW [11]. The level of generation of municipal waste in Belgium was 746 kg per capita in 2020, higher than in a great number of developed countries, such as the Netherlands, – (533 kg per capita), and Germany – (628 kg per capita) [12]. This resource is a valuable raw material for recycling or producing energy, the technologies of which have reached a very high level of development in Belgium.
Energy Balance
According to the BP Statistical Review of World Energy 2022, total primary energy consumption in Belgium in 2021 was 2.73 exajoules, with around 47.6% coming from oil, 22.3% from natural gas, 16.8% from nuclear energy, 9.2% from renewable energy, and 3.6% from coal [13]. Using the data from [3,13] we calculated the value of Belgium’s GDP per unit of energy use in 2020 to be $10.7, taking into account the PPP in 2011 (the equivalent of energy contained in one kg of oil) which is slightly lower than the world average energy efficiency of GDP.
Oil production between 2003-2021 remained practically unchanged, not exceeding the level of 28,800 barrels/day, and was 24,800 barrels/day in 2021 [14]. The volume of oil consumption also remained practically unchanged, with small annual fluctuations (Fig. 2), and in 2021 amounted to 631,200 barrels/day [14].
Source: U.S. Energy Information Administration (Oct 2022) / www.eia.gov
Figure 2. The production and consumption of fossil fuels in Belgium (coal – left, gas – in the center, oil – right)
BP’s review shows higher oil consumption rates in Belgium in 2021 – 638,000 barrels/day [13]. Oil imports, according to [3], amounted to 666,700 barrels/day in 2018. The consumption of natural gas in the country between 2003 and 2010 grew gradually, reaching a peak of 728 Bcf in 2010; however, since 2011 it has been decreasing and in 2021 totaled 641.5 Bcf [14]. According to the ВР Statistical review of World Energy 2022 [13], gas consumption in 2021 was 17 Bcm.
According to [3], the import of natural gas to Belgium in 2019 was 22.60 Bcm.
Coal consumption in the country has been gradually decreasing since 2001. In 2021 3.49 million short tons were consumed [14]. According to BP's report, in 2021, coal consumption totaled 0.10 exajoules [13].
Historically, Belgium has relied on fossil fuels for electricity production (Fig.3). It is important to notice the trend of a significant reduction in energy consumption throughout the country. According to the U.S. Energy Information Administration, in 2021, Belgium produced 94.87 TWh of electricity, where fossil fuels accounted for 25.8%, nuclear energy – 50.5%, renewables – 23.6%, and hydroelectricity – 0.1% (Fig.6).
Sources: U.S. Energy Information Administration (Oct 2022) | ||
| Figure 3. Electricity production in Belgium |
Belgium’s position in the comparative diagram of energy index is shown in Figure 4. As previously mentioned, fossil energy resources in Belgium are practically absent, therefore the first six indices are either not represented or are in the lower quarter of the diagram.
| Sources: 1. Crude oil proved reserves, 2021 / International Energy Statistic/Geography / U.S. Energy Information Administration (Nov 2021)*98 2. Natural gas proved reserves 2021 / International Energy Statistic / Geography / U.S. Energy Information Administration (Nov 2021) *99 3. Total recoverable coal reserves 2019 / International Energy Statistic / Geography / U.S. Energy Information Administration (Nov 2021) *81 4. Combination production-consumption for Crude oil 2018 / International Energy Statistic / Geography / U.S. Energy Information Administration (Nov 2021) *219 5. Combination production-consumption for Natural gas 2019 / International Energy Statistic / Geography / U.S. Energy Information Administration (Nov 2021) *123 6. Combination production-consumption for Coal 2019 / International Energy Statistic / Geography / U.S. Energy Information Administration (Nov 2021) *128 7. Electricity – from other renewable sources (% of total installed capacity), 2017 est. / The World Factbook / Library / Central Intelligence Agency *170 8. GDP per unit of energy use (PPP per unit of oil equivalent), 2020 *66 Primary energy consumption - BP Statistical Review of World Energy 2021/BP;GDP (purchasing power parity) - The World Factbook/Library/Central Intelligence Agency 9. Energy use (primary energy use of oil equivalent per capita) 2020 *127 Primary energy consumption – BP Statistical Review of World Energy 2021; Population - United Nations, Department of Economic and Social Affairs, Population Division (2019). World Population Prospects 2019, custom data acquired via website. Retrieved 15 November 2021*66 10. The Global Energy Architecture Performance Index Report (EAPI) 2017 / Rankings / Reports / World Economic Forum 11. Electric power consumption (kWh per capita), 2016 *217 Electricity Consumption - The World Factbook / Library / Central Intelligence Agency; Population - United Nations, Department of Economic and Social Affairs, Population Division (2019). World Population Prospects 2019, custom data acquired via website. Retrieved 15 November 2021 12. Combination of electricity production-consumption (kWh)/The World Factbook/Library/Central Intelligence Agency *216 * Total number of countries participating in ranking Figure 4. Energy indices of Belgium |
In terms of the share of electricity production from renewable energy sources (excluding hydropower), in 2017 Belgium ranked 7th, out of 170 countries selected for consideration.
In the Energy Architecture Performance Index 2017, which is based primarily on level economic growth, environmental safety, and energy independence of the country, including access to energy, Belgium places 34th out of 127 countries. Over the last 8 years the country has lost 7 positions in the rating.
In terms of GDP per unit of energy use Belgium in 2020 is 34th out of 66 countries, but this indicator per capita is substantially higher– 19th place in the world.
In terms of electricity consumption per capita, the country is 30th in the world, however, for the indicator of combination of electricity production-consumption, Belgium is 201st in the ranked list of 216 countries.
Energy Infrastructure
A territorial map of the distribution of the largest infrastructure projects of the fossil-fuel sector in Belgium is shown in Figure 5. In 2016, Belgian refineries had a total installed capacity of 739,800 bpd [15]. The largest refinery in the country is owned by Total and is located in Antwerp with an installed capacity of 360,000 bpd [16]. (Fig. 5). The country's only oil terminal is in Antwerp and is also home to the largest oil product storage facility with a reservoir volume of 1,100,000 m3 [17,18].
Figure 5. Basic infrastructural facilities of the fossil fuel sector in Belgium
Transportation of crude oil and petroleum products is carried out via pipelines with a length of 154 km and 535 km, respectively (Fig. 5). The Belgian gas system is represented by four gas processing plants and one gas storage facility; gas is transported within the country via a network of pipelines with a total length of 3,139 km (Fig. 5). Gas imports are carried through the Zeebrugge LNG terminal with an installed capacity of 9.0 bln cbm/y [19]. The map of the territorial distribution of the largest infrastructure electricity generation facilities in Belgium is shown in Figure 6. The share of fossil fuels in electricity generation in Belgium in 2021, according to the U.S. Energy Information Administration, was around 25.8% (Fig. 6).
Figure 6. Electricity production in Belgium
The country has a number of stations for the production of electricity from hydrocarbons, including 11 gas stations with a capacity of more than 300 MW and two nuclear plants with a capacity of more than 2,000 MW (Fig. 6). Belgian’s largest power plants are: the Seraing gas power plant, with a capacity of 485 MW [20]; and the Tihange nuclear power plant with three reactors, featuring a total installed capacity of 3,008 MW [21], generating 15% of the total national electricity output. Hydropower in Belgium has an insignificant share in electricity generation (0.1%), it is represented by two large pumped-storage plants and 115 small hydroelectric power stations, with a total capacity of 71.5 MW (Fig. 6). The largest pumped-storage plant is Coo-Trois-Ponts with an installed capacity of 1,164 MW [22].
Figure 7 shows the main infrastructure facilities in Belgium for the production of renewable energy. Figure 7. Renewable energy in Belgium: solar, wind and hydrogen
As noted above, renewable energy in Belgium in 2021 accounted for 23.6% of electricity generation and the total production of electricity from renewable sources – excluding hydropower – was 23.14 TWh (Fig. 7). In zones of high wind activity, located in the north of the country, there are 10 large wind parks, with a capacity of more than 30 MW each. In 2017 there were about 1098 wind farms in Belgium, with a total installed capacity of 2 848 MW [23]. The largest is the offshore Thornton Bank Wind Farm, with an installed capacity of 325 MW [24]. As noted in the previous chapter, the level of global horizontal radiation in some parts of the country can reach 3.0 kWh/m2, which is sufficiently high for energy production [6]. As a result, a large number of solar energy facilities are located in this territory, including 10 PV power plants that have a capacity of 1 MW. The largest PV park is Terra Nova, with an installed capacity of 15 MW, situated in an area of 20 hectares, which provides electricity to almost 4,000 families [25]. Belgium, is actively engaged in the production and use of hydrogen as an energy source for vehicles. As of December 2017, there are three large hydrogen filling stations in operation in the country (Figure 7). There are several Compressed Hydrogen Plants, the largest of which is situated in Antwerp and is operated by Air Liquide, with an installed capacity of 208,500 Nm3/hr [26]. Hydrogen fueling stations and hydrogen plants are connected via a network of hydrogen pipelines (Fig. 7).
Figure 8 shows the main bioenergy objects of Belgium for energy production. Figure 8. Renewable energy in Belgium: bioenergy
In 2021, the total installed bioenergy capacity was 0.93 GW.
The country has biomass and municipal waste processing plants, torrefaction plants; biogas, biodiesel, bioethanol, and pellet production (Fig.8). In 2016, E.ON converted the largest Langerlo coal-fired power plant to a power plant that uses biomass as feedstock, with an installed capacity of 400 MW [27]. Belgium is actively engaged in the production of bioethanol, with Wanze annually producing 300,000 m3 [28]. The Ghent Steelanol cellulosic bioethanol production plant is under construction, and will have an installed capacity of 60 t/y [29]. The main Belgian enterprises processing biomass are: Ghent Bioro, with an annual capacity of 250,000 tons of biodiesel [30]; Ruien biomass gasification plant with a capacity of 50 MWth [28]; and Burtonville-Vielsalm, which is capable of producing about 150,000 tons of pellets per year [31]. The market leader in the generation of electricity from municipal waste is Neder-Over-Heembeek (Brussels) which is capable of processing 515,000 tons annually [32]. The Amel torrefaction plant can produce about 38,000 tons of biocoal annually [33]. Within the framework of the “Belgian National Climate Change Adaptation Strategy” the country seeks to reduce its share of CO2 emissions, diversify energy supply and limit energy demand, particularly by increasing the capacity of renewable technologies and to increase cooperation and trade with neighboring countries [34].
2022 Belgian government raised the country’s offshore wind target to 8 GW by 2030 [35]. In 2017, Siemens and Senvion received contracts for the construction of new wind power facilities with a total capacity of 28.8 MW and 45 MW, respectively [36,37]. Research centers at the universities of Antwerp and Leuven have developed a technology that cleans the air while simultaneously generating energy. The air is purified, and hydrogen is produced from a part of degradation products. This hydrogen can be stored and later used as fuel [38]. The Flemish Institute for Technology Studies (VITO) has for many years studied the potential of deep geothermal energy in Belgium and in 2021 the geothermal developer HITA has signed a cooperation agreement with ENGIE to develop of deep geothermal projects in the country. By 2030, it is planned to operate 10 geothermal installations for a total production of about 600 GWh of heat annualy [39].
One of the leading solar energy companies – Solar Century – together with the zinc plant, NystarBudel, is developing a solar park with an area of 60 hectares in Budela in Brabant. The solar park, to be equipped with 170,000 solar panels is expected to get commissioned in 2022, and will be able to provide electricity to 16,000 families [40,41].
Education and Innovation
The set of indices reflecting the position of Belgium among other countries in the field of education and innovation can be seen in Figure 9. As can be seen from the diagram presented, Belgium has a very high level of academic achievement. Belgium ranks 22nd out of 132 countries considered in the ranking of countries of the Global Innovation Index 2021 (see diagram).
| Sources: 1. The Global Innovation Index 2021, Rankings / Knowledge / World Intellectual Property Organization / Cornell University, INSEAD, and WIPO (2021): Energizing the World with Innovation. Ithaca, Fontainebleau, and Geneva *132 2. Patent Grants 2011-2020, resident & abroad / Statistical country profiles / World Intellectual Property Organization *185 3.Patents in Force 2020 / Statistical country profiles / World Intellectual Property Organization *109 4. QS World University Rankings 2022 *97 5. SCImago Country Rankings (1996-2020) / Country rankings / SCImago, (n.d.). SIR-SCImago Journal & Country Rank [Portal]. Retrieved 17 Nov 2021 *240 6. Internet users in 2018 / The World Factbook / Central Intelligence Agency *229 7. Internet users in 2018 (% Population) / The World Factbook / Central Intelligence Agency *229 8. Government expenditure on education, total (% of GDP), 2019 / United Nations Educational, Scientific, and Cultural Organization (UNESCO) Institute for Statistics. License: CCBY-4.0 / Data as of September 2021*177 9. Research and development expenditure (% of GDP), 2018 / UNESCO Institute for Statistics. License: CCBY-4.0 / Data *119 10. Scientific and technical journal articles, 2018 / National Science Foundation, Science and Engineering Indicators. License: CCBY-4.0 / Data *197 * Total number of countries participating in ranking Figure 9. The indices of education and innovation in Belgium |
According to the number of patents granted to Belgian nationals, both domestically and abroad, the country ranks 16th in the world. Similarly, by the number of patents in force issued, the country places 14th in the world, indicating the country's favorable conditions for innovation.
In terms of government expenditure on education as a percentage of the country's GDP, the country ranks higher than the world average – 21st out of 177 countries selected for consideration. Consequently, 9 Belgian universities are included in the rating of the world’s leading universities - “QS University Rating”. It is also worth noting that the country's GDP is high, therefore in absolute terms the level of government expenditure on education is considerable. In terms of public expenditure on research and development as a percentage of GDP, Belgium is 11th, and is well positioned when considering the number of publications of specialists in scientific and technological journal and patent activities. Belgium is 22nd out of 240 participating countries in the Scimago ranking, and in Scientific and Journal Activities is ranked 24th out of 197 countries, behind a number of European countries, including France and Italy.
Belgian Universities, such as Vrije Universiteit Brussel, KU Leuven, Ghent University, the University of Antwerp, the University of Mons, and the University of Liege train specialists in various fields of energy, including Electrical Engineering, Electromechanical Engineering etc. In the field of synthetic fuel production, the leader in patenting among Belgian companies is Total Research and Technology Feluy. Research and development in this field is carried out by Katholieke Universiteit Leuven, the University of Ghent, University of Antwerp. The University of Ghent is the leader in the number of publications in the field of gas hydrates. Sofitech N.V. is the absolute leader in the number of inventions in the field of gas hydrates and hydrocarbon production from reservoirs with low permeability. Vrije Universiteit Brussel is conducting research in this area. Sofitech N.V. and Magotteaux International S.A. lead in the number of patents in the field of non-traditional oil production. Solvay leads in the number of publications. In the area of Coal Seam Methane Sofitech N.V. has the largest number of patents, and Epslog S.A. has the largest number of publications.
The leading patent holders in the field of bioenergy are Organic Waste Systems, Albemarle Europe SPRL, Greenwatt. The University of Ghent, AEBIOM and Katholieke Universiteit Leuven are conducting research in this area. A large number of Belgian companies patent technical solutions in the field of energy production from renewable sources. In the field of solar energy are Cockerill Maintenance & Ingenierie S.A., AGC Glass Europe S.A., and AGC Flat Glass S.A. Leading research organizations in this field are Katholieke Universiteit Leuven, Universite de Liege, and ESTIF.
ZF Wind Power Antwerpen N.V., Hansen Transmissions International N.V., High Wind N.V. are leading patent holders in the in the field of wind power; research in this field is being conducted by Katholieke Universiteit Leuven, Vrije Universiteit Brussel, the University of Ghent.
Ecology and Environment Protection
The diagram of environmental indices presented in Figure 10 reflects, to some extent, the ecological situation in the country. First of all, the country demonstrates a relatively high level of CO2 emissions in general, and per capita. At the same time, the situation is aggravated by the fact that Belgium ranks 46th of the 61 countries responsible for more than 90% of global CO2 emissions related to energy in the Climate Change Performance Index (CCPI) 2022, with an assessment of "medium" (i.e., among countries with an average level of negative influence among those selected for consideration).
In terms of forest area as a percentage of the country, Belgium is 138th in the world, demonstrating a negative trend in the forest area change – 150th in the world. Clearly, the preservation of forests is a priority for the state. The situation is brightened by a relatively high valuation of Belgium in the Environmental Performance Index rankings (EPI), which focuses primarily on assessing the environmental performance of national governments policies, aimed at reducing the negative impact on the environment, and the rational use of natural resources. Here, the country is 15th out of 180 countries surveyed in 2020, behind a number of European countries, such as Finland, Sweden and Denmark, and shows a positive trend.
| Sources: 1. CO2 total emission by countries 2020 / European Commission / Joint Research Centre (JRC) / Emission Database for Global Atmospheric Research (EDGAR)*208 2. CO2 per capita emission 2020/European Commission/Joint Research Centre (JRC) / Emission Database for Global Atmospheric Research (EDGAR) *208 3. Forest area 2020 (% of land area) / The Global Forest Resources Assessment 2020 / Food and Agriculture Organization of the United Nations *234 4. Forest area change 2010-2020 (1000 ha/year) / The Global Forest Resources Assessment 2020 / Food and Agriculture Organization of the United Nations *234 5. The Environmental Performance Index (EPI) 2020 / Rankings / Yale Center for Environmental Law & Policy / Yale University *180 6. Annual freshwater withdrawals (m3 per capita), 2017 *179 Annual freshwater withdrawals, total (billion m3), 2017 – Food and Agriculture Organization, AQUASTAT data. /License: CC BY-4.0; Population – United Nations, Department of Economic and Social Affairs, Population Division (2019). World Population Prospects 2019, custom data acquired via website. Retrieved 15 November 2021 7. The National Footprint Accounts 2017 (Biocapacity Credit / Deficit) / Global Footprint Network *188 8. Methane emissions (kt of CO2 equivalent), 2018 / Data for up to 1990 are sourced from Carbon Dioxide Information Analysis Center, Environmental Sciences Division, Oak Ridge National Laboratory, Tennessee, United States. Data from 1990 are CAIT data: Climate Watch. 2020. GHG Emissions. Washington, DC: World Resources Institute. Available at: License : Attribution-NonCommercial 4.0 International (CC BY-NC 4.0) *191 9. The Climate Change Performance Index (CCPI) 2022 / Overall Results / Jan Burck, Thea Uhlich, Christoph Bals, Niklas Höhne, Leonardo Nascimento / Germanwatch, NewClimate Institute & Climate Action Network *60 * Total number of countries participating in ranking Figure 10. Environmental Indices of Belgium |
The overall picture is aggravated by the Ecological Footprint Atlas rating, according to which Belgium is among a number of ecological debtors.
References
[1] List of sovereign states and dependencies by area / Wikipedia / en.wikipedia.org/wiki/List_of_sovereign_states_and_dependencies_by_area
[2] List of countries and dependencies by population density / Wikipedia / en.wikipedia.org/wiki/List_of_countries_and_dependencies_by_population_density
[3] Belgium / The world factbook / Library / Central Intelligence Agency / www.cia.gov
[4] GDP, PPP (constant 2011 international $) / World Bank, International Comparison Program database. License: CC BY-4.0 / Data / The World Bank / www.worldbank.org
[5] GDP per capita, PPP (current international $)/ World Bank, International Comparison Program database. License: CC BY-4.0 / Data / The World Bank / www.worldbank.org
[6] Solar resource data obtained from the Global Solar Atlas, owned by the World Bank Group and provided by Solargis / Global Solar Athlas / globalsolaratlas.info
[7] Wind Map / Global Wind Atlas 2.0, a free, web-based application developed, owned and operated by the Technical University of Denmark (DTU) in partnership with the World Bank Group, utilizing data provided by Vortex, with funding provided by the Energy Sector Management Assistance Program (ESMAP). For additional information: globalwindatlas.info
[8] 2010 Survey of Energy Resources (PDF) / World Energy Council / www.worldenergy.org/
[9] Agricultural land (% of land area) / Food and Agriculture Organization, electronic files and web site. License: CC BY-4.0 / Data / The World Bank / www.worldbank.org
[10] Forest area (% of land area) /Food and Agriculture Organization, electronic files and web site. License: CC BY-4.0 / Data / The World Bank / www.worldbank.org
[11] 2016 Annual U.S. & Global Geothermal Power Production Report (PDF) / Geoenergy.org / geoenergy.org
[12] Municipal waste statistics Updated / 19 July 2021 / Full list / Statistics Explained / Eurostat / ec.europa.eu
[13] BP Statistical Review of World Energy June 2022 (PDF) / BP / www.bp.com
[14] International Energy Statistic / Geography / U.S. Energy Information Administration (Oct 2022) /http://www.eia.gov/beta/international/
[15] OPEC Annual Statistical Bulletin 2017 / Organization of the Petroleum Exporting Countries (OPEC) / www.opec.org
[16] Belgium / Wikipedia / en.wikipedia.org/wiki/List_of_oil_refineries
[17] Gunvor Petroleum Antwerp / Gunvor Group / gunvorgroup.wpengine.com
[18] Antwerp Oil Terminal / Port of Antwerp / www.portofantwerp.com
[19] Gas Infrastructure Europe (GIE) / Belgium LNG Terminals / www.gie.eu
[20] Seraing / EDF Luminus / edfluminus.edf.com
[21] Tihange / EngieElectrabel / corporate.engie-electrabel.be
[22] Hydroelectric power / Wikipedia / en.wikipedia.org/wiki/Energy_in_Belgium
[23] Énergie éolienne en Belgique / Wikipedia / fr.wikipedia.org/wiki/%C3%89nergie_%C3%A9olienne_en_Belgique
[24] Thorntonbank Wind Farm / Wikipedia / en.wikipedia.org/wiki/Thorntonbank_Wind_Farm /
[25] Terranova Solar Is The Largest Solar Park In The Low Countries (PDF) / Deme / www.demegroup.com
[26] Major Compressed Hydrogen Plants over 1000 Nm3/hr / Merchant Hydrogen Production Capacities in Europe / Hydrogen Tools / h2tools.org
[27] Belgium and Coal / Source Watch / www.sourcewatch.org
[28] Large Industrial Users of Energy Biomass / IEA Bioenergy Task 40 / bioenergytrade.org
[29] ArcelorMittal – Project Ghent Steelanol / IEA Bioenergy Task 39: Commercializing Liquid Biofuels from Biomass / demoplants.bioenergy2020.eu
[30] Bioro / Flanders Biobased Valley / www.fbbv.be
[31]Pellets / Industrie du Bois Vielsalm&Cie S.A. / www.ibv-cie.be
[32]Brussels incineration plant / Industry About / www.industryabout.com
[33] Still more future hope than reality / Google / www.sunwindenergy.com
[34] Belgian National Climate Change Adaptation Strategy / Climat.be / www.climat.be
[35] WindEurope strongly supports a higher target for offshore wind for Belgium/ 16 March 2022 / Wind Europe / windeurope.org
[36] Siemens awarded wind turbine order from EDF Luminus for two projects in Belgium (PDF) / Siemens / www.siemens.com
[37] Senvion concludes five orders in Belgium totaling 45 megawatts / Windfair / w3.windfair.net
[38] New technology generates power and hydrogen from polluted air / Fuel Cells Works / fuelcellsworks.com
[39] ENGIE and HITA partner on geothermal development in Belgium / 18 May 2021 / Think Geoenergy / www.thinkgeoenergy.com
[40] Solarcentury en Nyrstar bouwen zonnepark van 170.000 zonnepanelen / 09/10/2017 / Metalot / www.metalot.nl
[41] Bollendonk Solar PV Park, Netherlands / February 17, 2022 / Power technology / www.power-technology.com
The sources of charts and curves are specified under the images.
For more information about the energy industry in Belgium see here