
Contents
General State of the Economy
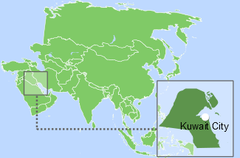
Kuwait, the official name – The State of Kuwait, is a country in the Middle East with its capital in El Kuwait. The country has borders with Iraq (in the north and west), and Saudi Arabia (in the south), and is also washed by the waters of the Persian Gulf.
According to 2021 statistics Kuwait, which in terms of size is placed 157th in the world, is home to more than 3,0 million people. In terms of population density, the country is 57th in the world from 250 countries considered [1,2,3]. The length of the coastline is 499 km [3].
The political form of government is constitutional monarchy, the official language is Arabic. The administrative map of the country is divided into 6 governorates [3].
Oil and gas resources are the main source of income and economic growth of Kuwait. For seven out of 9 indices the positioning of the country is higher than the world average, in the top half of the graph (i.e. among 50% of the best countries in the world included in the rating), however, in terms of high-technology exports and the annual GDP growth, the country is below the world average (figure 1).
| Sources: 1. GDP (purchasing power parity), 2020 est. / The World Factbook/Library/Central Intelligence Agency *228 2. GDP - per capita (PPP), 2020 / The World Factbook/Library/Central Intelligence Agency *229 3. Inflation rate (consumer prices), 2019 est. / The World Factbook/Library/Central Intelligence Agency *228 4. Charges for the use of intellectual property, receipts (BoP, current US$), 2020 / International Monetary Fund, Balance of Payments Statistics Yearbook, and data files. / License: CC BY-4.0 *88 5. The Global Competitiveness Index 2019 / Rankings / Reports / World Economic Forum *141 6. High-technology exports (current US$) 2019-2020 / United Nations, Comtrade database through the WITS platform / License: CCBY-4.0 / Data *134 7. 2021 Index of Economic Freedom / International Economies / The Heritage Foundation *178 8. Reserves of foreign exchange and gold, 2017 est. / The World Factbook / Library / Central Intelligence Agency *195 9. Annual average GDP growth in %, for the last 10 years (2011-2020) / World Bank national accounts data, and OECD National Accounts data files / License: CC BY-4.0 *206 10. Public debt (% of GDP), 2017 est. / The World Factbook / Library / Central Intelligence Agency(from smallest to largest) *210 * Total number of countries participating in ranking Figure 1. Economic Indices of Kuwait |
From the beginning of 2000, with a slight decline between 2008 and 2010, in 2017 and 2020, the country has experienced sustained GDP growth in purchasing power parity, which in 2019 reached the level of $209.74 billion (66th place in the world) [3,4]. GDP at purchasing power parity per capita showed stable growth from 2002 to 2007, then until 2010 there was a sharp fall and multidirectional movement until 2020, when it reached $49,900 (29th place), falling from $ 54,834 in 2015 [3,5].
According to The Global Competitiveness Report 2019, presented by the World Economic Forum, Kuwait was 46th (out of an estimated total of 141 countries). This rating reflects the effectiveness of the use of the country’s own resources for sustainable development. In addition to a number of economic indicators this index also takes into account such variables as education, health, level of innovation, etc.
In the list of 134 countries that exported high-tech products in 2019-2020, Kuwait was 94th - close to the world average. According to the Index of Economic Freedom, which is based on freedom of business, freedom from government action, property protection, and freedom from corruption, the country was 78th in 2021. In terms of gold reserves and foreign exchange reserves in 2017 Kuwait was 48th, ahead of Qatar. In terms of annual GDP growth (2011-2020) in percentage Kuwait was 114th in the world. The country's public debt in 2017 amounted to only 20.6% of GDP, which is close to its best results (Fig.1).
According to Standard & Poor's rating in October 2017, the country was rated as АА - «very strong» - «…the issuer has a very high ability to pay interest on debt obligations and debts themselves».
Energy Resources
Kuwait has significant reserves of fossil fuel resources (Table 1). According to proven reserves of oil and natural gas, the country is ranked 6th and 19th in the world, respectively [3]. According to data for 2018, in terms of tons of oil equivalent, proved oil reserves amounted to 89.6 %, natural gas – 10.4% (Figure 5).
According to [3,6], in 2020 the proven oil reserves in Kuwait were estimated to be at 101.5 billion barrels. In terms of this indicator Kuwait is second only to Saudi Arabia, Iraq and Iran in the region. At current production levels oil reserves in Kuwait could last for more than 100 years. Kuwait is an active participant in the organization of oil exporters (OPEC), where the share of its reserves is 8.4% of the total reserves of the participating countries [7].
Table 1. Fossil energy resources of Kuwait
| Resource /Explanations | Crude oil | Natural gas | Coal | Natural Bitumen | Tight Oil | Coal mine methane | Shale Oil |
|---|---|---|---|---|---|---|---|
| Value | 101.5 | 1.784 | no data | no data | no data | no data | no data |
| Unit | billion bbl | Tcm | - | - | - | - | |
| Year | 2018 | 2018 | - | - | - | - | |
| Source | [3] | [3] | [-] | [-] | [-] | [-] | [-] |
Proven natural gas reserves in Kuwait in 2018 according to [3,6] were 1.784-1.7 Tcm, which at current production levels natural gas reserves in the country could last for approximately 106 years.
Kuwait’s total primary energy supply (TPES) in 2017 was fully provided by fossil fuels - oil and gas, and the volume of oil supplies significantly exceeded the volume of gas supplies according to data from [8].
Due to its geographical position Kuwait has quite good reserves of such renewable energy sources as solar and wind. A selection of basic indicators of this type of resource is presented in Table 2.
Table 2. Renewable energy resources of Kuwait
| Resource/ Explanations | Solar Potential (DNI)* | Wind Potential (50 м)* | Hydro Potential | Bio Potential (agricultural area) | Bio Potential (forest area) | Geothermal Potential | Municipal Solid Waste |
|---|---|---|---|---|---|---|---|
| Value | 5.0-5.5 | 6.5-7.0 | no data | 8.4 | 0.4 | no data | 5.72 |
| Unit | kWh/m2/day | m/s | - | % of land area | % of land area | - | kg/per capita/day |
| Year | 2018 | 2018 | - | 2016 | 2016 | - | 2012 |
| Source | [9] | [10] | [-] | [11] | [12] | [-] | [13] |
*for the majority of the territory of the country
The level of direct solar irradiation for the majority of the country is 5.0-5.5 kWh/m2/day [9].
The distribution of wind resources is as follows: for the majority of the country the wind speed is 6.5-7.0 m/s, and in the east of the country in the area of El-Kuwait it reaches a maximum mark of 7.5-8.9 m/s at an altitude of 50 metres [10].
About only 8.4% of the territory of Kuwait was covered by agricultural land in 2015 [11], and this area has been increasing slightly over the last half century; while 0.4% is forested [12].
The level of municipal waste generation in Kuwait is 5.72 kg per capita per day; this is substantially higher than, for example, in Saudi Arabia (1.3 kg per capita per day), and Qatar (1.33 kg per capita per day). A decrease of up to 4 kg per capita per day is predicted by 2025 [13].
Energy Balance
According to the BP Statistical Review of World Energy 2021, primary energy consumption in Kuwait in 2020 was 1.51 Exajoule, and was dominated by oil - 50.3%, followed by natural gas 49% [6].
Using data from [3,6] we calculated an estimated value of the energy intensity of GDP in Kuwait in 2020 - $5.8 taking into account PPP in 2011 prices per unit of energy expended (the equivalent of energy contained in one kg of oil equivalent/$ PPP per kg of oil equivalent), which is significantly lower than the world average level of GDP energy efficiency.
Kuwait is the 9th largest oil producer in the world [3]. Oil production between 2001 and 2019 grew, with annual fluctuations, and in 2020 amounted to 2,735 thousand barrels/day [15]. The volume of oil consumption in the country since 2001 has shown a steady growth (Fig. 2), and in 2019 it was 342 thousand barrels/day [15].
BP reported lower oil production in Kuwait in 2020 as being 2 686 thousand barrels/day; consumption was at the level of 411 thousand barrels/day [6].
Source: U.S. Energy Information Administration (Dec 2021) / www.eia.gov
Figure 2. The production and consumption of fossil fuels in Kuwait (left – coal, in the center – gas, right – oil)
Oil exports from Kuwait in 2018 amounted to 1,838 million barrels/day, the main destination being Asia-Pacific (66%) [14,16].
Gas production and consumption in the country grew similarly to oil consumption, reaching 689 Bcf in 2019. Gas consumption in the period from 2001 also showed an increase, and by 2019 it reached 859 Bcf [15]. According to the BP Statistical Review of World Energy 2021 [6], gas production in 2020 was 15.0 Bcm, while consumption was 21.8 Bcm. Kuwait imports LNG mainly from Qatar and Nigeria; in 2019 the volume of imports was 170 Bcf [14].
Between 2010 and 2020, coal consumption rose sharply from a level of 0.10 to 281 in 2019 and 65 thousand short tons [15].
For electricity production Kuwait almost completely relies on fossil fuel resources (Fig.3).
Sources: U.S. Energy Information Administration (Dec 2021) / www.eia.gov | ||
| Figure 3. Electricity generation in Kuwait |
According to the U.S. Energy Information Administration the country produced 70.5 TWh of electricity in 2019, where fossil fuels accounted for 100% (Fig.6).
Kuwait's position in the comparative diagram of energy index is shown in Fig. 4. Kuwait is at the top of the list of countries in terms of production/consumption of oil, however, having significant gas resources, in terms of its production/consumption ratio, the country is below the world average.
In the EAPI of 2016 (Energy Architecture Performance Index) Kuwait is ranked 115th, behind a number of EU countries, but ahead of Oman and Saudi Arabia. This index is based first on the level economic growth, environmental safety, and energy independence of the country, including access to energy. Over the last 8 years the country has dropped 8 positions in the rating.
| Sources: 1. Crude oil proved reserves, 2021 / International Energy Statistic/Geography / U.S. Energy Information Administration (Nov 2021)*98 2. Natural gas proved reserves 2021 / International Energy Statistic / Geography / U.S. Energy Information Administration (Nov 2021) *99 3. Total recoverable coal reserves 2019 / International Energy Statistic / Geography / U.S. Energy Information Administration (Nov 2021) *81 4. Combination production-consumption for Crude oil 2018 / International Energy Statistic / Geography / U.S. Energy Information Administration (Nov 2021) *219 5. Combination production-consumption for Natural gas 2019 / International Energy Statistic / Geography / U.S. Energy Information Administration (Nov 2021) *123 6. Combination production-consumption for Coal 2019 / International Energy Statistic / Geography / U.S. Energy Information Administration (Nov 2021) *128 7. Electricity – from other renewable sources (% of total installed capacity), 2017 est. / The World Factbook / Library / Central Intelligence Agency *170 8. GDP per unit of energy use (PPP per unit of oil equivalent), 2020 *66 Primary energy consumption - BP Statistical Review of World Energy 2021/BP;GDP (purchasing power parity) - The World Factbook/Library/Central Intelligence Agency 9. Energy use (primary energy use of oil equivalent per capita) 2020 *127 Primary energy consumption – BP Statistical Review of World Energy 2021; Population - United Nations, Department of Economic and Social Affairs, Population Division (2019). World Population Prospects 2019, custom data acquired via website. Retrieved 15 November 2021*66 10. The Global Energy Architecture Performance Index Report (EAPI) 2017 / Rankings / Reports / World Economic Forum 11. Electric power consumption (kWh per capita), 2016 *217 Electricity Consumption - The World Factbook / Library / Central Intelligence Agency; Population - United Nations, Department of Economic and Social Affairs, Population Division (2019). World Population Prospects 2019, custom data acquired via website. Retrieved 15 November 2021 12. Combination of electricity production-consumption (kWh)/The World Factbook/Library/Central Intelligence Agency *216 * Total number of countries participating in ranking Figure 4. Energy indices of Kuwait |
In terms of electricity consumption per capita, the country was 5th in the world in 2017, however, for the indicator of combination of electricity production-consumption, Kuwait is 40th is the world.
It should also be noted that Kuwait has a significant excess in the volume of electricity production compared to its consumption.
Energy Infrastructure
A territorial map of the distribution of the largest infrastructure projects of the fossil-fuel sector in Kuwait is shown in Figure 5.
In the total potential of fossil energy resources, oil plays the predominant role – 89.6%, gas amounts to 10.4% (Figure 5).
The main gas fields are concentrated in the North of Kuwait, and the country also plans to develop the Dorra offshore field, which could bring the country an additional 500-800 MMcf/day (Figure 5). [14]. Gas is imported into the country via the Mina Al-Ahmadi LNG terminal, managed by KNPC, which has a capacity of 5.8 Mtpa [17]. Transportation of gas, condensate and gas condensate within the country is carried via a network of pipelines with a total length of 261 km (Figure 5).
Greater Burgan is considered to be one of the leading oil fields in the country and in the world, the production of which can reach about 1.7 million bbl/day, according to [14].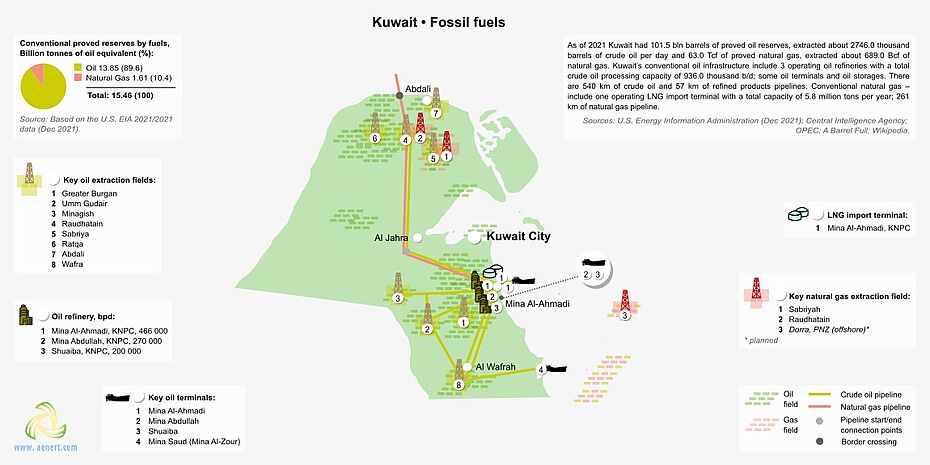
Figure 5. Basic infrastructure facilities of the fossil fuel sector in Kuwait
In 2016, Kuwait refineries had a total installed capacity of 936 thousand barrels/day [18]. The largest being Mina Al-Ahmadi, KNPC with an installed capacity of 466 000 bbl/day [14] (Fig.5). Oil and petroleum products are exported via 4 oil terminals, and crude oil and petroleum products are transported via pipelines with a total length of 540 km and 57 km, respectively (Fig. 5).
A map of the territorial distribution of Kuwait’s largest infrastructure facilities for electricity generation is presented in Figure 6.
According to the U.S. Energy Information Administration, the share of fossil fuels in energy production in Kuwait in 2017 was almost 100% (Fig.6).
The country has a significant number of power plants for the production of electricity from fossil fuels, including power plants with a capacity of over 100 MW, one oil power plant, four power plants, and three combined type power plant (Fig. 6).
Figure 6. Electricity production and renewable energy in Kuwait
The largest power plants in Kuwait are: Az-Zour North gas power plant, with a capacity of 1,631 MW, Doha West oil power plant, with an installed capacity of 2541 MW, and Sabiya combined type power plant with an installed capacity of 5866 MW [19].
As already noted above, the country has sufficient potential for generating electricity by means of photovoltaics – the level of direct solar radiation in certain parts of the country can reach 5.5 kWh/m2/day[9]. This technology has not yet received visible development. However, since 2016, a PV power plant with an installed capacity of 10 MW has been operating not far from the Umm Gudair oil field [20]. In 2016 Kuwait also began constructing the first СSP parabolic type with thermal storage plant – called Shagaya, which will have a capacity of 50 MW (commissioned in December 2018) [21].
Education and Innovation
The set of indices reflecting the position of Kuwait among other countries in the field of education and innovation can be seen in Figure 7.
Kuwait is 72nd out of 132 countries considered in the ranking of countries of the Global Innovation Index 2021 (see diagram). According to the indicator for the number of patents granted (2011-2020) to Kuwait residents, both inside the country and abroad, the country is ranked 85th out of 185 countries considered.
In terms of government expenditure on education as a percentage of the country's GDP, the country demonstrates a result above the world average – 36th out of 177 countries considered. As a result, a number of universities of Kuwait were included in the 2022 QS University Rating.
In terms of government expenditure on research and development as a percentage of the country's GDP, Kuwait is 97th behind a number of European countries, Oman and Algeria. However, Kuwait is well positioned when considering the number of publications of specialists in scientific and technological journal and patent activities. The country is 7th out of 239 participating countries in the Scimago ranking, and in Scientific and Technical Journal Activities it is ranked 78th out of240 countries. The country is also among the leaders in the region in terms of the number of Internet users.
| Sources: 1. The Global Innovation Index 2021, Rankings / Knowledge / World Intellectual Property Organization / Cornell University, INSEAD, and WIPO (2021): Energizing the World with Innovation. Ithaca, Fontainebleau, and Geneva *132 2. Patent Grants 2011-2020, resident & abroad / Statistical country profiles / World Intellectual Property Organization *185 3.Patents in Force 2020 / Statistical country profiles / World Intellectual Property Organization *109 4. QS World University Rankings 2022 *97 5. SCImago Country Rankings (1996-2020) / Country rankings / SCImago, (n.d.). SIR-SCImago Journal & Country Rank [Portal]. Retrieved 17 Nov 2021 *240 6. Internet users in 2018 / The World Factbook / Central Intelligence Agency *229 7. Internet users in 2018 (% Population) / The World Factbook / Central Intelligence Agency *229 8. Government expenditure on education, total (% of GDP), 2019 / United Nations Educational, Scientific, and Cultural Organization (UNESCO) Institute for Statistics. License: CCBY-4.0 / Data as of September 2021*177 9. Research and development expenditure (% of GDP), 2018 / UNESCO Institute for Statistics. License: CCBY-4.0 / Data *119 10. Scientific and technical journal articles, 2018 / National Science Foundation, Science and Engineering Indicators. License: CCBY-4.0 / Data *197 * Total number of countries participating in ranking Figure 7. The indices of education and innovation in Kuwait |
Universities of Kuwait, such as the American University of the Middle East, the Australian College of Kuwait, and Kuwait University train specialists in various fields of energy, including Civil Engineering, Electrical Engineering and Petroleum, etc. Kuwait University is actively engaged in research in the field of synthetic fuel production and coalbed methane. Kuwait Oil Company publishes scientific papers in the field of associated petroleum gas.
Research of unconventional oil is carried out at Kuwait Oil Company, Kuwait University, and the Kuwait Institute for Scientific Research.
A large number of research institutes conduct research in the field of technologies for the production of energy from renewable sources. In the field of solar power – the American University of the Middle East, the Kuwait Institute for Scientific Research, and in the field of wind power – Kuwait University, the American University of the Middle East, and the Australian College of Kuwait.
Ecology and Environment Protection
The diagram of environmental indices presented in Figure 8 to some extent reflects the ecological situation in the country, which in the case of Kuwait is extremely negative.
First of all, the country demonstrates a relatively high level of CO2 emissions in general and per capita. It is also necessary to note the high level of methane emissions in the country. Of course, this is a consequence of the intensive extraction and use of oil and natural gas, but it is also evident that the degree of utilization of associated petroleum gas or the degree of purification of harmful emissions at industrial enterprises is insufficient.
| Sources: 1. CO2 total emission by countries 2020 / European Commission / Joint Research Centre (JRC) / Emission Database for Global Atmospheric Research (EDGAR)*208 2. CO2 per capita emission 2020/European Commission/Joint Research Centre (JRC) / Emission Database for Global Atmospheric Research (EDGAR) *208 3. Forest area 2020 (% of land area) / The Global Forest Resources Assessment 2020 / Food and Agriculture Organization of the United Nations *234 4. Forest area change 2010-2020 (1000 ha/year) / The Global Forest Resources Assessment 2020 / Food and Agriculture Organization of the United Nations *234 5. The Environmental Performance Index (EPI) 2020 / Rankings / Yale Center for Environmental Law & Policy / Yale University *180 6. Annual freshwater withdrawals (m3 per capita), 2017 *179 Annual freshwater withdrawals, total (billion m3), 2017 – Food and Agriculture Organization, AQUASTAT data. /License: CC BY-4.0; Population – United Nations, Department of Economic and Social Affairs, Population Division (2019). World Population Prospects 2019, custom data acquired via website. Retrieved 15 November 2021 7. The National Footprint Accounts 2017 (Biocapacity Credit / Deficit) / Global Footprint Network *188 8. Methane emissions (kt of CO2 equivalent), 2018 / Data for up to 1990 are sourced from Carbon Dioxide Information Analysis Center, Environmental Sciences Division, Oak Ridge National Laboratory, Tennessee, United States. Data from 1990 are CAIT data: Climate Watch. 2020. GHG Emissions. Washington, DC: World Resources Institute. Available at: License : Attribution-NonCommercial 4.0 International (CC BY-NC 4.0) *191 9. The Climate Change Performance Index (CCPI) 2022 / Overall Results / Jan Burck, Thea Uhlich, Christoph Bals, Niklas Höhne, Leonardo Nascimento / Germanwatch, NewClimate Institute & Climate Action Network *60 * Total number of countries participating in ranking Figure 8. Environmental Indices of the Kuwait |
In terms of forest area as a percentage of land area, Kuwait was 220th out of 234 countries in 2020; nevertheless, the tendency associated with its change between 2010 and 2020 looks more positive, and in terms of this indicator the country is 136th in the world.
According to the Environmental Performance Index (EPI) 2020, which is focused primarily on the environmental activities of national governments, aimed at reducing the negative impact of the environment and rational use of natural resources, the country is 47th out of 180 participating countries. Finally, it is worth mentioning that according to the Ecological Footprint Atlas rating Kuwait is among a number of ecological debtors.
References
[1] List of countries and dependencies by area / Wikipedia / en.wikipedia.org/wiki/List_of_sovereign_states_and_dependencies_by_area
[2] List_of_countries_and_territories_by_population_density / Wikipedia / en.wikipedia.org/wiki/List_of_countries_and_territories_by_population_density
[3] Kuwait / The world factbook / Library / Central Intelligence Agency / https://www.cia.gov/the-world-factbook/countries/kuwait/#energy
[4] GDP, PPP (constant 2011 international $) / World Bank, International Comparison Program database. License: CC BY-4.0 / Data / The World Bank / www.worldbank.org
[5] GDP per capita, PPP (current international $) / World Bank, International Comparison Program database. License: CC BY-4.0 / Data / The World Bank / www.worldbank.org
[6] BP Statistical Review of World Energy 2021 (PDF) / BP / www.bp.com
[7] OPEC Share of World Crude Oil Reserves / OPEC Oil reserves / Data / Organization of the Petroleum Exporting Countries / www.opec.org
[8] Kuwait / Statistics / © OECD / IEA 2018, IEA Publishing, Licence: www.iea.org/t&c / International Energy Agency / www.iea.org
[9]Solar resource data obtained from the Global Solar Atlas, owned by the World Bank Group and provided by Solargis / Global Solar Atlas / globalsolaratlas.info
[10] Kuwait Wind Map / Global Wind Atlas 2.0, a free, web-based application developed, owned and operated by the Technical University of Denmark (DTU) in partnership with the World Bank Group, utilizing data provided by Vortex, with funding provided by the Energy Sector Management Assistance Program (ESMAP). For additional information: globalwindatlas.info
[11] Agricultural land (% of land area) /Food and Agriculture Organization, electronic files and web site. License: CC BY-4.0 / Data / The World Bank / www.worldbank.org
[12] Forest area (% of land area) /Food and Agriculture Organization, electronic files and web site. License: CC BY-4.0 / Data / The World Bank / www.worldbank.org
[13] What a Waste 2012 (PDF) / 2012 / Publications / The World Bank / www.worldbank.org
[14] Kuwait / Select Country / U.S. Energy Information Administration (November 2021) / www.eia.gov/beta/international/analysis.php
[15] International Energy Statistic / Geography / U.S. Energy Information Administration (Jan 2020) / www.eia.gov/beta/international
[16] Kuwait facts and figures / Member Countries / About Us / Organization of the Petroleum Exporting Countries / www.opec.org
[17] IGU 2017 World LNG Report (PDF) / Files / IGU / www.igu.org
[18] OPEC Annual Statistical Bulletin 2017 (PDF) / Publications / Organization of the Petroleum Exporting Countries / www.opec.org /
[19] Electrical Energy 2017, Statistical Year Book (PDF) / Statistics / About us / Ministry of Electricity & Water of the State of Kuwait / www.mew.gov.kw
[20] Kuwait’s First Solar Power Plant Becomes Operational / November 3, 2016 / RenewableEnergy.com Editorial Team / RenewableEnergy.com / renewableenergy.com
[21] Shagaya CSP Project / Concentrating Solar Power Projects in Kuwait / By Country / The National Renewable Energy Laboratory / solarpaces.nrel.gov
The sources of charts and curves are specified under the images.
For more information about the energy industry in Kuwait see here