
Contents
General State of the Economy
Sweden, officially the Kingdom of Sweden, is a European state on the Scandinavian Peninsula. The western border of the country separates it from Norway; the eastern border from Finland. The country also has access to the Baltic Sea. As of 2020 Sweden is home to around 10 million people, and is the fifth largest country in Europe. In terms of population density, the country is 202nd in the world [1,2,3]. The total length of the country's coastline is 3 218 km [3]. The capital city is Stockholm, Sweden is a parliamentary constitutional monarchy and the official language is Swedish. The administrative map of the country is divided into 21 counties [3].
Due to the successful combination of the free market and extensive social benefits, Sweden has one of the highest living standards in the world and this is reflected in the comparative diagram of various economic indices – Figure 1.
| Sources: 1. GDP (purchasing power parity), 2020 est. / The World Factbook/Library/Central Intelligence Agency *228 2. GDP - per capita (PPP), 2020 / The World Factbook/Library/Central Intelligence Agency *229 3. Inflation rate (consumer prices), 2019 est. / The World Factbook/Library/Central Intelligence Agency *228 4. Charges for the use of intellectual property, receipts (BoP, current US$), 2020 / International Monetary Fund, Balance of Payments Statistics Yearbook, and data files. / License: CC BY-4.0 *88 5. The Global Competitiveness Index 2019 / Rankings / Reports / World Economic Forum *141 6. High-technology exports (current US$) 2019-2020 / United Nations, Comtrade database through the WITS platform / License: CCBY-4.0 / Data *134 7. 2021 Index of Economic Freedom / International Economies / The Heritage Foundation *178 8. Reserves of foreign exchange and gold, 2017 est. / The World Factbook / Library / Central Intelligence Agency *195 9. Annual average GDP growth in %, for the last 10 years (2011-2020) / World Bank national accounts data, and OECD National Accounts data files / License: CC BY-4.0 *206 10. Public debt (% of GDP), 2017 est. / The World Factbook / Library / Central Intelligence Agency (from smallest to largest) *210 * Total number of countries participating in ranking Figure 1. Economic Indices of Sweden |
The export of technological equipment, iron ore and the timber industry form the base of the economy [3]. For almost all indices shown, Sweden is positioned in the top quarter of the diagram (i.e. among the top 25% of countries included in the rating). Since the early 1990s, the country has experienced a steady growth in GDP at purchasing power parity, both in general and per capita [4,5]. However, after several years of steady growth, GDP at purchasing power parity fell slightly to $524 billion in 2020 from $532 billion in 2018 (39th in the world) [3]. The country’s GDP at purchasing power parity per capita is somewhat higher (27th place in the world in 2020), and it has also declined slightly after a long positive period; from $52 300 in 2018 to $50 700 in 2020 [3]. The inflation rate rose from 1.1% in 2016 to 1.7% in 2019. According to this indicator, the country is 97th in the world [3].
According to the Global Competitiveness Report 2019, Sweden placed 8th out of a total of 141 countries considered, behind Switzerland, Germany and the Netherlands; notably, the country has gained one position compared to the previous year’s rating. This rating measures the effectiveness of the use of the country’s own resources for sustainable development. In addition to a number of economic indicators this index also takes into account such variables as education, health, level of innovation, etc.
In a list of countries that exported high-tech products in 2019-2020, the country was 25th out of 134 countries, behind Austria and the Czech Republic. According to the Index of Economic Freedom, which is based on freedom of business, freedom from government intervention, property protection, and freedom from corruption, Sweden was 21th in 2021 out of the 178 countries considered; behind Finland. In terms of gold reserves and foreign exchange reserves, Sweden ranked 36th in the world in 2017. According to the indicator for the average GDP growth in percentage over the last 10 years (2011-2020), in 2020 the country was 132nd out of 206 countries. In terms of public debt, calculated as a percentage of the country's GDP, Sweden was ranked 124th out of 210 countries considered in 2017.
Energy Resources
Sweden does not have significant reserves of fossil resources (Table 1). Nevertheless, there are small coal reserves in the country – about 1 million tons; shale gas reserves amount to 9.8 Tcf, and kerogen oil resources to 6 144 million barrels [6,7,8].
Table 1. Fossil energy resources of Sweden
| Resource /Explanations | Crude oil | Natural gas | Coal | Shale Gas* | Tight Oil | Oil Shale |
|---|---|---|---|---|---|---|
| Value | no data | no data | 1 | 9.8 | no data | 6114 |
| Unit | - | - | million tonnes | Tcf | - | million bbl |
| Year | - | - | 2016 | 2014 | - | 2008 |
| Source | - | - | [6] | [7] | - | [8] |
*unproved technically recoverable
Sweden has a rich variety of renewable energy sources. A selection of basic indicators for this type of resource is presented in Table 2. The level of global horizontal solar radiation in most of the country is low < 2,7 kWh/m2/day.
The maximum level of solar radiation can be observed in the south of the country around Gotland island – around 2.8-3.0 kWh/m2/day [9]. The distribution of wind resources is as follows: in most of the country the wind speed is < 6,5 m/s, but in the southern part of the country, at a height of 50 m, it can reach over 7.5 m/s [10].
Sweden’s economically exploitable hydropotential in 2013 was 20 000 GWh/year [11], which allows for the intensive use of hydro resources for electricity generation.
Table 2. Renewable energy resources of Sweden
| Resource/ Explanations | Solar Potential (GHI)* | Wind Potential (50 м)* | Hydro energy Potential** | Bio Potential (agricultural area) | Bio Potential (forest area) | Municipal Solid Waste |
|---|---|---|---|---|---|---|
| Value | <2.7 | <6.5 | 20 000 | 7.5 | 68.7 | 431 |
| Unit | kWh/m2/day | m/s | GWh/year | % of land area | % of land area | kg per capita |
| Year | 2018 | 2018 | 2013 | 2018 | 2018 | 2020 |
| Source | [9] | [10] | [11] | [12] | [13] | [14] |
*for most of the territory of the country
**economically exploitable potential
About 68.7% Sweden is forested and 7.5% is covered by agricultural land [12,13]. In 2018 the level of municipal waste generation in Sweden was 431 kg per capita, behind, for example, Norway (726 kg per capita). This resource is a valuable raw material for recycling or energy production, the technologies of which have reached a very high level of development in Sweden [14].
Energy Balance
According to the 2021 BP Statistical Review of World Energy, total primary energy consumption in Sweden in 2020 amounted to 2.20 Exajoules, around 25% of which was from oil, 1.8% from natural gas, 3.2% from coal, 21.8% from nuclear energy, 29.5% from hydropower, and 18.6% from renewable energy sources [15]. Using the data from [3,12], we calculated GDP per unit of energy use in Sweden in 2020 – 10 US dollars, taking into account the PPP in 2011 prices per unit of energy used (equivalent to the energy contained in one kilogram of oil), which roughly corresponds to the world average energy efficiency.
The volume of oil consumption in the country since 2002 has declined (Fig.2) and in 2021 totalled 311 thousand barrels/day [16]. According to BP, this figure was 290 thousand barrels/day in 2020 [15]. According to the Swedish Energy Agency, the total consumption of oil products in the country in 2017 was 87 TWh [17]. Oil imports in 2017 amounted to 400 200 barrels/day [3].
Source: U.S. Energy Information Administration (Dec 2021) / www.eia.gov
Figure 2. The Production and consumption of fossil fuels in Sweden (coal – left, gas – in the center, oil – right)
Natural gas consumption in Sweden showed steady growth between 2008 and 2010, but then declined rapidly (Fig. 2); in 2017 consumption reached the level of 27 Bcf, compared to 56 Bcf in 2010 [16]. After 2017, natural gas consumption went up again, reaching about 47 Bcf in 2021. According to the BP Statistical Review of World Energy in June 2021 [15] it was estimated at 1.1 billion m3 in 2020. According to the Swedish Energy Agency, gas consumption in 2017 totalled 6 TWh [17]. 764.5 million m3 of gas was imported in 2017 [3].
Coal consumption in the country gradually decreased – albeit with annual fluctuations – between 2001 and 2020, and totalled 2.09 million short tons in 2021 [16]; in 2020, according to BP, it amounted to 0.07 Exajoules [15].
Historically, Sweden has had a high share of nuclear and hydro energy in electricity production (Fig. 3).
Sources: U.S. Energy Information Administration (Dec 2021) / www.eia.gov | ||
| Figure 3. Electricity production in Sweden |
In 2021 Sweden produced around 165.27 TWh of electricity and the share of renewable resources in the total production volume has consistently increased, particularly with regard to biomass and wind energy (Fig. 6).
Sweden’s position in the comparative diagram of energy index is shown in Figure 4. As previously mentioned, Sweden does not have significant reserves of fossil resources so the first six indices are either not represented in the diagram or are extremely low. The volume of production of fossil energy resources is much lower than the level of their consumption in Sweden. On the one hand , this requires sustainable import support, however it also encourages the development of energy-saving technologies and renewable energy. Other indices are more convincing. In a rating from 2017 listing countries by their level of production of electricity from renewable sources (excluding hydropower) Sweden was 15th out of 170 countries selected for consideration.
In the Energy Architecture Performance Index 2017, which is based primarily on the level of economic growth, environmental safety, and energy independence of the country, including access to energy, Sweden is 3rd, only behind Norway and Switzerland. The country has consistently ranked high on these indicators. In terms of GDP per unit of energy used, Sweden is slightly below the world average. However, the index of energy use per capita is much higher – 14th among 66 countries considered.
| Sources: 1. Crude oil proved reserves, 2021 / International Energy Statistic/Geography / U.S. Energy Information Administration (Nov 2021)*98 2. Natural gas proved reserves 2021 / International Energy Statistic / Geography / U.S. Energy Information Administration (Nov 2021) *99 3. Total recoverable coal reserves 2019 / International Energy Statistic / Geography / U.S. Energy Information Administration (Nov 2021) *81 4. Combination production-consumption for Crude oil 2018 / International Energy Statistic / Geography / U.S. Energy Information Administration (Nov 2021) *219 5. Combination production-consumption for Natural gas 2019 / International Energy Statistic / Geography / U.S. Energy Information Administration (Nov 2021) *123 6. Combination production-consumption for Coal 2019 / International Energy Statistic / Geography / U.S. Energy Information Administration (Nov 2021) *128 7. Electricity – from other renewable sources (% of total installed capacity), 2017 est. / The World Factbook / Library / Central Intelligence Agency *170 8. GDP per unit of energy use (PPP per unit of oil equivalent), 2020 *66 Primary energy consumption - BP Statistical Review of World Energy 2021/BP;GDP (purchasing power parity) - The World Factbook/Library/Central Intelligence Agency 9. Energy use (primary energy use of oil equivalent per capita) 2020 *127 Primary energy consumption – BP Statistical Review of World Energy 2021; Population - United Nations, Department of Economic and Social Affairs, Population Division (2019). World Population Prospects 2019, custom data acquired via website. Retrieved 15 November 2021*66 10. The Global Energy Architecture Performance Index Report (EAPI) 2017 / Rankings / Reports / World Economic Forum 11. Electric power consumption (kWh per capita), 2016 *217 Electricity Consumption - The World Factbook / Library / Central Intelligence Agency; Population - United Nations, Department of Economic and Social Affairs, Population Division (2019). World Population Prospects 2019, custom data acquired via website. Retrieved 15 November 2021 12. Combination of electricity production-consumption (kWh)/The World Factbook/Library/Central Intelligence Agency *216 * Total number of countries participating in ranking Figure 4. Energy indices of Sweden |
In terms of electricity consumption per capita, the country is 8th in the world , however, for the indicator of combination of electricity production-consumption, Sweden is 23rd in the ranked list of 216 countries.
Energy Infrastructure
A territorial map showing the distribution of the largest infrastructure projects of the fossil fuel sector in Sweden is shown in Figure 5.
As previously mentioned, kerogen oil reserves account for 78.5% and shale gas reserves account for 21.5% of the energy potential of unconventional fossil resources. Swedish refineries, which are mainly concentrated in the south, have a total installed capacity of 515 000 barrels/day (Fig. 5). The country's largest refinery is Preemraff Lysekil Oil Refinery, managed by Preem, with an installed capacity of 220 000 barrels/day [18]. The main oil terminal is Göteborg (4 million m3), and the biggest oil storage is Brofjorden (Lysekil) Oil Storage Terminal (580 000 m3) [19,20].
There is one large gas storage facility in the country – Skallen, which has a capacity of 10 million m3 [21]. There are two LNG import terminals, the largest of which is Linde Brunnsviksholme LNG Import Terminal near Stockholm, with a storage capacity of 20 000 m3 [22]. Domestic gas is transported through a 1 626 km long pipeline network (Fig. 5).

Figure 5. Basic infrastructural facilities of the fossil fuel sector in Sweden
According to EU Commission Energy Statistics of the EU-28 Countries, the share of fossil fuels in electricity production in Sweden in 2020 was only 0.1% (Fig. 6). The Central Intelligence Agency's estimates for 2016 are significantly higher – 5% [3]. For this indicator Sweden is behind only Switzerland, Iceland and Norway in Europe [3].
The country has several stations for the production of electricity from fossil fuels, including power plants with a capacity of more than 100 MW, such as two oil power plants, two gas power plants and three combined cycle power plants, as well as a large number of power plants with less output (Fig. 6).
The largest power plants in Sweden are: gas – Öresundsverket, with total capacity of 440 MW [23], oil; Karlshamn (Stärnö) Oil-fired power plant, with installed capacity of 1 005 MW, combined cycle; and Aroskraft (Vasteras) Combined Power Plant with installed capacity of 650 MW [24,25]. In the southern part of the country, on the coast of the Baltic Sea, there are three nuclear power plants; the most powerful of these is Ringhals Nuclear Power Plant (3 932 MW) [26].
As noted above, hydropower in Sweden has a significant share in electricity generation, and in 2020 it was represented by several hydro and pumped storage power plants that produced 71.07 TWh (Fig. 6). The most powerful hydroelectric power plant is the Harsprånget Hydro Power Plant with an installed capacity of 871 MW [27]. Among pumped storage power plants, the Juktan Hydro Pumped Storage Station has an installed capacity of 335 megawatts [28].
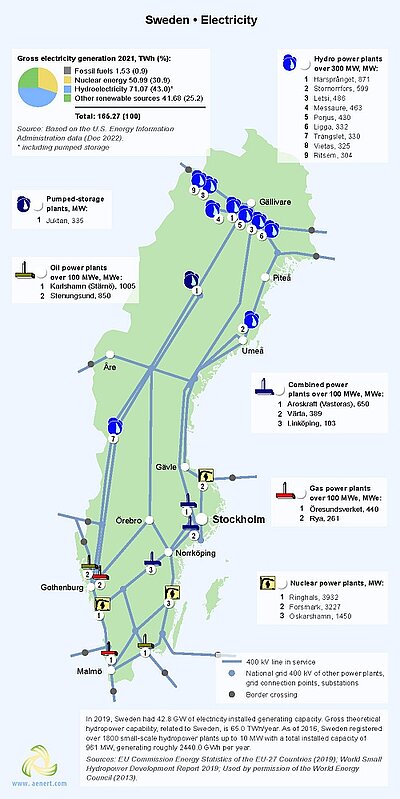
Figure 6. Electricity production in Sweden
As mentioned previously, the level of solar radiation in the most densely populated areas of the country can reach 2.7 kWh/m2, which is a sufficient resource for the production of energy through photovoltaics [9]. There is one large photovoltaic station, Onsmyran Solar PV Plant, with installed capacity of 1 MW [29].
In areas with high wind activity there are 11 large wind parks, each with a capacity of more than 90 MW. The largest is Björkhöjden Wind Farm with an installed capacity of 270 MW [30].
The level of municipal waste is 431 kg per person per year [14]. There is large number of waste-processing plants of various capacities, including 10 power plants with a capacity of more than 200 000 tpy. The largest is Stockholm-Högdalen Waste-to-Energy Plant with an installed capacity of 600 000 tpy [31]. The ScanDust Landskrona Plasma Gasification Plant has an installed capacity of 200 TPD [32].
Bioenergy has a significant share in energy production in Sweden, and in 2019 biomass generated around 13.08 TWh (Fig.7). The country has biomass processing plants, biogas production plants, biodiesel plants, bioethanol plants, pellets and landfill gas plants, etc.
E.On owns the largest biomass processing plant, the Åby Biomass power plant with an installed capacity of more than 130MW [33]. Termochemical GoBiGas Phase 1BTL-FT, managed by Göteborg Energi AB, has an installed capacity of 20 MW [34].
Lantmännen Energi produces around 235 000 m3 of bioethanol annually at the largest plant in the country: Norrköping [34]. The largest biodiesel plant in the country is Piteå, SunPine Biodiesel Plant, which produces about 100 000 m3 annually [35]. There are a number of biomass gasification plants in the country, the largest of which is the Södra Cell Värö Pulp Mill Biomass Gasification Plant, with an installed capacity of 35 MWh [36]. The largest pellet production company is located in Härnösand, the SCA Energy Wood Pellet Plant, which produces 160 000 tons annually [37]. In 2016, Sweden produced more than 1.9 TWh of biogas at 282 plants, and this resource is used as fuel for vehicles. In terms of biogas production, Skåne is the leader in electricity generation, with 47 plants generating 417.5 GW [38]. The largest torrefication plant is the ETPC Torrefaction Plant at Umeå, with an installed capacity of 30 000 tons/year [39].
The country has an 18 km long hydrogen pipeline at Stenungsund, and four hydrogen gas stations (Fig. 7).
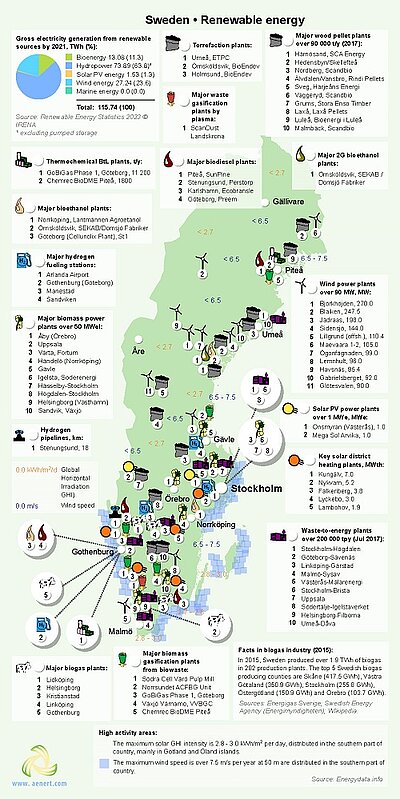
Figure 7. Renewable energy in Sweden
The largest producer of fuel in Sweden, Preem, plans to produce about 3 million m3 of biofuel by 2030. The company has announced a partnership with Vattenfall, which will supply hydrogen gas for this project, using wind and hydroelectric power [42].
Education and Innovation
The set of indices reflecting the position of Sweden among other countries in the field of education and innovation can be seen in Figure below. As can be seen from the diagrams presented, Sweden is one of the world leaders in this segment of indicators, which contributes to technological development in the field of energy.
In the ranking of countries of the Global Innovation Index 2021, Sweden is second after Switzerland from the 132 countries considered (see diagram). According to the number of patents granted to Swedish nationals, both domestically and abroad, the country ranks 12th in the world. Similarly, by the number of valid patents, the country is 20th in the world, indicating the country's favourable conditions for innovation.
The level of government expenditure on education is very high. Eight Swedish universities are included in the QS University Rating. In addition, Sweden’s GDP is very high, so the expenditure on education in absolute terms is also substantial.
In the ranking of countries, in terms of government expenditure on research and development as a percentage of GDP, the country is third behind Israel and Republic of Korea. Sweden is well positioned when considering the number of publications of specialists in scientific and technological journals; in the Scimago, rating Sweden ranks 18th out of 240 countries, and in the Scientific and Technical Journal Activities places 22nd out of 197 countries.
| Sources: 1. The Global Innovation Index 2021, Rankings / Knowledge / World Intellectual Property Organization / Cornell University, INSEAD, and WIPO (2021): Energizing the World with Innovation. Ithaca, Fontainebleau, and Geneva *132 2. Patent Grants 2011-2020, resident & abroad / Statistical country profiles / World Intellectual Property Organization *185 3.Patents in Force 2020 / Statistical country profiles / World Intellectual Property Organization *109 4. QS World University Rankings 2022 *97 5. SCImago Country Rankings (1996-2020) / Country rankings / SCImago, (n.d.). SIR-SCImago Journal & Country Rank [Portal]. Retrieved 17 Nov 2021 *240 6. Internet users in 2018 / The World Factbook / Central Intelligence Agency *229 7. Internet users in 2018 (% Population) / The World Factbook / Central Intelligence Agency *229 8. Government expenditure on education, total (% of GDP), 2019 / United Nations Educational, Scientific, and Cultural Organization (UNESCO) Institute for Statistics. License: CCBY-4.0 / Data as of September 2021*177 9. Research and development expenditure (% of GDP), 2018 / UNESCO Institute for Statistics. License: CCBY-4.0 / Data *119 10. Scientific and technical journal articles, 2018 / National Science Foundation, Science and Engineering Indicators. License: CCBY-4.0 / Data *197 * Total number of countries participating in ranking Figure 8. The indices of education and innovation in Sweden |
Swedish universities, including KTH Royal Institute of Technology, Uppsala University, the University of Gothenburg and Karlstad University, train specialists in various fields of energy, including Renewable Electricity Production, Wind Power Project Management, Science in Environmental and Energy Engineering, Electrical Engineering, etc.
Cortus AB and Siemens AG are among the leaders in patenting among Swedish companies in the field of synthetic fuel production. Studies in this field have been conducted by KTH Royal Institute of Technology, Chalmers University of Technology, and Luleå University of Technology.
In the field of unconventional oil processing, the following companies are prominent – Siemens AG, and Alfa Laval Corporate AB. Uppsala University and Linköping University have the highest number of publications in this area.
A large number of Swedish companies patent technical solutions in the field of energy production from renewable sources. In the field of bioenergy, patenting leaders among Swedish companies are Bioendev AB, Cortus AB, Tekniska Verken Linkoeping AB, Bioprocess Control Sweden AB, and Scandinavian Biogas Fuels AB. Studies in this field have been conducted by KTH Royal Institute of Technology, Chalmers University of Technology, and the Swedish University of Agricultural Sciences.
Notable enterprises in the field of solar energy include Siemens AG and Climatwell AB. KTH Royal Institute of Technology, Lund University and Uppsala University have the highest number of publications in this area.
Leaders in the field of wind power are Siemens AG and Senvion SE. Studies in this field have been conducted by KTH Royal Institute of Technology, Luleå University of Technology and Uppsala University.
Ecology and Environment Protection
A diagram of environmental indices is shown in Figure 9. This figure shows the indices that have an indirect effect on the energy sector, but in many respects shape its future.
Due to the country's extensive use of clean energy sources, Sweden demonstrates a relatively law level of CO2 emissions, both in general and per capita.
| Sources: 1. CO2 total emission by countries 2020 / European Commission / Joint Research Centre (JRC) / Emission Database for Global Atmospheric Research (EDGAR)*208 2. CO2 per capita emission 2020/European Commission/Joint Research Centre (JRC) / Emission Database for Global Atmospheric Research (EDGAR) *208 3. Forest area 2020 (% of land area) / The Global Forest Resources Assessment 2020 / Food and Agriculture Organization of the United Nations *234 4. Forest area change 2010-2020 (1000 ha/year) / The Global Forest Resources Assessment 2020 / Food and Agriculture Organization of the United Nations *234 5. The Environmental Performance Index (EPI) 2020 / Rankings / Yale Center for Environmental Law & Policy / Yale University *180 6. Annual freshwater withdrawals (m3 per capita), 2017 *179 Annual freshwater withdrawals, total (billion m3), 2017 – Food and Agriculture Organization, AQUASTAT data. /License: CC BY-4.0; Population – United Nations, Department of Economic and Social Affairs, Population Division (2019). World Population Prospects 2019, custom data acquired via website. Retrieved 15 November 2021 7. The National Footprint Accounts 2017 (Biocapacity Credit / Deficit) / Global Footprint Network *188 8. Methane emissions (kt of CO2 equivalent), 2018 / Data for up to 1990 are sourced from Carbon Dioxide Information Analysis Center, Environmental Sciences Division, Oak Ridge National Laboratory, Tennessee, United States. Data from 1990 are CAIT data: Climate Watch. 2020. GHG Emissions. Washington, DC: World Resources Institute. Available at: License : Attribution-NonCommercial 4.0 International (CC BY-NC 4.0) *191 9. The Climate Change Performance Index (CCPI) 2022 / Overall Results / Jan Burck, Thea Uhlich, Christoph Bals, Niklas Höhne, Leonardo Nascimento / Germanwatch, NewClimate Institute & Climate Action Network *60 * Total number of countries participating in ranking Figure 9. Environmental Indices of Sweden |
Sweden is also included in the Climate Change Performance Index (CCPI), which shows the 60 countries responsible for more than 90% of the world's energy-related CO2 emissions. The authors of the report note a reduction in emissions of harmful substances per capita. However, there are fluctuations in emissions from the agricultural sector, and the country’s renewable energy target is still not sufficient.
In relation to forest area as a percentage of total land area, Sweden is 21st in the world. However, there is a negative trend in forest area change, and here the country is only 179th.
Nevertheless, the country has a relatively high Environmental Performance Index (EPI) 2020 rating, which focuses primarily on assessing the environmental performance of national governments. In this rating Sweden is 5th out of 180 member countries, behind France, Switzerland and Denmark.
At the end of the review it is also worth noting that, according to the Ecological Footprint Atlas, Sweden is among the environmental creditors.
References
[1] List of sovereign states and dependencies by area / Wikipedia / https://en.wikipedia.org/wiki/List_of_sovereign_states_and_dependencies_by_area
[2] List of countries and dependencies by population density / Wikipedia / https://en.wikipedia.org/wiki/List_of_countries_and_dependencies_by_population_density
[3] Sweden / The world factbook / Library / Central Intelligence Agency / https://www.cia.gov/
[4] GDP, PPP (constant 2011 international $) / World Bank, International Comparison Program database. License: CC BY-4.0 / Data / The World Bank / http://www.worldbank.org/
[5] GDP per capita, PPP (current international $)/ World Bank, International Comparison Program database. License: CC BY-4.0 / Data / The World Bank / http://www.worldbank.org/
[6] Coal / 2016 Survey of Energy Resources (PDF) / World Energy Council / www.worldenergy.org/
[7] World Shale Resource Assessments (PDF)/ U.S. Energy Information Administration / https://www.eia.gov/
[8] 2010 Survey of Energy Resources (PDF) / World Energy Council / www.worldenergy.org/
[9] Solar resource data obtained from the Global Solar Atlas, owned by the World Bank Group and provided by Solargis / Global Solar Atlas / http://globalsolaratlas.info/
[10] Wind Map / Global Wind Atlas 2.0, a free, web-based application developed, owned and operated by the Technical University of Denmark (DTU) in partnership with the World Bank Group, utilizing data provided by Vortex, with funding provided by the Energy Sector Management Assistance Program (ESMAP). For additional information: https://globalwindatlas.info
[11] Hydro / 2013 Survey of Energy Resources (PDF) / World Energy Council / www.worldenergy.org/
[12] Agricultural land (% of land area) / Food and Agriculture Organization, electronic files and web site. License: CC BY-4.0 / Data / The World Bank / http://www.worldbank.org
[13] Forest area (% of land area) /Food and Agriculture Organization, electronic files and web site. License: CC BY-4.0 / Data / The World Bank / http://www.worldbank.org/
[14] Municipal waste statistics Updated / Full list / Statistics Explained / Eurostat / https://ec.europa.eu/
[15] BP Statistical Review of World Energy 2021 (PDF) / BP / https://www.bp.com/
[16] International Energy Statistic / Geography / U.S. Energy Information Administration /http://www.eia.gov/beta/international/
[17] Energy in Sweden 2017 (Excel) / Swedish Energy Agency / http://www.energimyndigheten.se/
[18] Refineries / About Preem / Preem AB / https://www.preem.se/en/
[19] Terminals and services / Port of Gothenburg / https://www.portofgothenburg.com/
[20] SDK Shipping / The Port of Brofjorden / http://sdkshipping.com/
[21] Technical information / Swedegas / https://www.swedegas.com/
[22] Industrial Gases Sweden’s first LNG terminal is now opened / AGA / http://www.aga.lv/
[23] Öresundsverket CHP Plant, Sweden / Power Technology / http://www.power-technology.com/
[24] Karlshamn Power Station / Wikipedia / https://en.wikipedia.org/wiki/Karlshamn_Power_Station
[25] Vasteras hjarta / Mälarenergi AB / https://www.malarenergi.se/
[26] Ringhals / Vattenfall AB Powerplants / http://powerplants.vattenfall.com/
[27] Harsprånget /Vattenfall AB Powerplants / http://powerplants.vattenfall.com/
[28] List of power stations in Sweden / Wikipedia / https://en.wikipedia.org/wiki/List_of_power_stations_in_Sweden
[29] Solparken, Västerås: / Wikipedia / https://sv.wikipedia.org/wiki/Solparken,_V%C3%A4ster%C3%A5sSweden
[30] Wind Power projects / Statkraft / https://www.statkraft.com/
[31] Hogdalenverket / Fortum / https://www.fortum.com/
[32] Plasma Gasification: An Examination of The Health, Safety, and Environmental Records of Established Facilities (PDF) / Prepared by DOVETAIL PARTNERS, INC. / Prepared for The City of Palisade, Minnesota / June DOVETAIL PARTNERS, INC. / http://www.dovetailinc.org/
[33] E.ON VärmeSverige AB i Örebroregionen. Presentation 2012 (PDF) / Lansstyrelsen / http://www.lansstyrelsen.se/
[34] "Biofuels in Sweden" (PDF) / European Technology and Innovation Platform: Bioenergy / / http://www.etipbioenergy.eu/
[35] A brand new renewable engine fuel / Advanced Biofuels USA / http://advancedbiofuelsusa.info/
[36] Sweden / Svensk Gastekniskt Center AB / http://www.sgc.se/
[37] Pellets franHarnosandvarmerSundsvall / Allehanda / http://www.allehanda.se/
[38] Produktion och användning av biogas och rötrester år 2015 / Energigas Sverige / http://www.energigas.se/
[39] Biomass torrefaction technology: Techno-economic status and future prospects. December 2013. /Bothwell Batidzirai, A.P.R. Mignot, Wouter Schakel, Andre Faaij. / Research Gate / https://www.researchgate.net/
[40] Statistics and forecast Q2 2017 / Svensk Vindenergi – Swedish Wind Energy Association, SWEA / http://svenskvindenergi.org/
[41] Arise AB / Ongoing construction / http://www.arise.se/en/ongoing-construction
[42] Vattenfall / Preem and Vattenfall collaborate on large-scale biofuel project / https://corporate.vattenfall.com/
The sources of charts and curves are specified under the images.
For more information about the energy industry in Sweden see here