Contents
General State of the Economy
China, officially the People's Republic of China, is a country in East Asia. Its capital city is Beijing. The country has borders with the DPRK and Russia (to the northeast), Mongolia (to the north), Kazakhstan and Russia (to the northwest), Kyrgyzstan, Tajikistan and Afghanistan (to the southwest), with Pakistan, India, Nepal and Bhutan (to the southwest), and Myanmar, Laos, Vietnam (to the south). It has access to the Pacific Ocean.
China is the 3rd largest country in the world in terms of territory, and is home to more than 1 410 million people as of 2022. In terms of population density, the country is 85th in the world [1,2,3]. The total length of the country's coastline is 14,500 km [3].
| China/ the People's Republic of China | ||
|---|---|---|
| Capital: Beijing | Density: 145/km2 | Currency: Renminbi (元/¥) (CNY) |
| Official languages: Chinese | Life expectancy at birth: 78.08 years | GDP (PPP): $32.897 trillion (2023 est.) |
| National Day: 01 October | Area: 9,596,961 km2 | GDP - per capita (PPP): $23,308 (2023 est.) |
| Population: 1,411,750,000 (2023 est.) | Coastline: 14,500 km | Internet country code: .cn |
Source: [1,2,3.4.5]
| Sources: 1. GDP (purchasing power parity), 2020 est. / The World Factbook/Library/Central Intelligence Agency *228 2. GDP - per capita (PPP), 2020 / The World Factbook/Library/Central Intelligence Agency *229 3. Inflation rate (consumer prices), 2019 est. / The World Factbook/Library/Central Intelligence Agency *228 4. Charges for the use of intellectual property, receipts (BoP, current US$), 2020 / International Monetary Fund, Balance of Payments Statistics Yearbook, and data files. / License: CC BY-4.0 *88 5. The Global Competitiveness Index 2019 / Rankings / Reports / World Economic Forum *141 6. High-technology exports (current US$) 2019-2020 / United Nations, Comtrade database through the WITS platform / License: CCBY-4.0 / Data *134 7. 2021 Index of Economic Freedom / International Economies / The Heritage Foundation *178 8. Reserves of foreign exchange and gold, 2017 est. / The World Factbook / Library / Central Intelligence Agency *195 9. Annual average GDP growth in %, for the last 10 years (2011-2020) / World Bank national accounts data, and OECD National Accounts data files / License: CC BY-4.0 *206 10. Public debt (% of GDP), 2017 est. / The World Factbook / Library / Central Intelligence Agency(from smallest to largest) *210 * Total number of countries participating in ranking Figure 1. Economic Indices of China |
China is the second largest highly developed economy in the world, which is reflected in Figure 1. For 6 out of 10 indices the positioning of the country is higher than the world average, in the top 25% of the leading countries in the world included in the rating. However, in terms of economic freedom, China is below the world average. From the early 1990s the country experienced sustained GDP growth in purchasing power parity both in general and per capita [4,5]. Over the last few years GDP at purchasing power parity has grown from $21.3 trillion in 2018 to $23.00 trillion in 2020 (1st place in the world) [3,4]. The country’s GDP at purchasing power parity per capita is significantly lower (102nd place), but has also been demonstrating positive dynamics: from $15,200 in 2018 to $16,400 in 2020 [3]. The level of inflation almost doubled from 1.5% in 2017 to 2.8% in 2019 [3]. According to The Global Competitiveness Report 2019, presented by the World Economic Forum, China was 28th (out of a total of 141 countries considered), losing one ranking position from the previous year. This rating measures the effectiveness of China’s use of its resources for sustainable development; in addition to a number of economic indicators this index also takes into account such variables as education, health, level of innovation, etc. In terms of high-technology exports between 2019-2020, China was at the very top of the list of 134 countries, ahead of Germany and the USA. According to the Index of Economic Freedom, which is based on freedom of business, freedom from government intervention, property protection, and freedom from corruption, China was 107th in 2021, out of the 178 considered, placing it among the "mostly unfree" countries. In terms of gold reserves and foreign exchange reserves China was far ahead of many countries, including some EU countries, as of 2017. In terms of annual GDP growth China ranks 6th in the world. In terms of public debt as a % of GDP China is 111th out of 210 countries. Many Chinese energy companies, such as the State Grid, Sinopec Group, China National Petroleum, China Resources National, PetroChina, China Petroleum & Chemical Corp., CNOOC ltd, China Coal Energy Co Ltd, etc. are included in rankings of the largest energy companies, such as the Global 500 and S & P Global Platts 2017 Top 250.
Energy Resources
China has significant reserves of fossil and unconventional energy resources (Table 1). In terms of oil and gas reserves, the country was 12th and 9th in the world, respectively, and in terms of coal reserves the country is second only to the USA [3,6]. According to data for 2021 in terms of tons of oil equivalent, proven coal reserves were 100.24; natural gas was 5.99; and oil was 3.55 (Fig.5). The Matrix of unconventional resources looks somewhat different: oil shale (kerogen) – 60.8%; shale gas – 32.7%; shale (tight) oil – 4.9%; coal mine methane utilization potential – 1.5%; and oil sands and extra heavy oil – 0.1% (Fig.7).
Table 1. Fossil energy resources of China
| Resource /Explanations | Crude oil* | Natural gas* | Coal* | Oil Sands and Extra Heavy Oil** | Shale Gas** | Tight (Shale) Oil** | Coal mine methane | Oil Shale (Kerogen)*** |
|---|---|---|---|---|---|---|---|---|
| Value | 26(1.5%) | 223(3.1%) | 157 847(13.6%) | 750 | 1 115.5 | 32.2 | 1 310-3 287 | 354 430 |
| Unit | billion barrels | Tcf | million short tons | million barrels | Tcf | billion barrels | Bcm | million barrels |
| Year | 2021 | 2020 | 2021 | 2008 | 2015 | 2015 | 2018 | 2008 |
| Source | [19] | [19] | [19] | [10] | [9] | [9] | [8,6] | [10] |
*share of the country’s reserves in world total is provided in brackets
**reserves
***in-place resources
According to the Central Intelligence Agency, at the beginning of 2018 proven oil reserves in China were estimated at 25.63 billion barrels [3]; the 12th largest in the world. Proven oil reserves at the end of 2020 were estimated at 26 billion barrels in BP’s annual report [6].
Proven natural gas reserves in China at the beginning of 2018 were 5.44 Tcm, according to [3] and 8.4 Tcm at the end of 2020, according to [6].
In 2020 coal reserves in China were estimated at 143 197 million tonnes according to ВР [6], and according to Bundesanstalt für Geowissenschaften und Rohstoffe (BGR), they were estimated at 128 112 million tons in 2016 [7]. According to Advanced Energy Technologies calculations, the methane utilization potential (according to the methodology based on methane emissions from coal mining [8] and its reserves in 2018 from [6]) was 1 310-3 287 Bcm. According to Bundesanstalt für Geowissenschaften und Rohstoffe (BGR) [7], CBM reserves in 2018 were estimated at 340 Bcm. China has the largest shale gas reserves in the world, the unproved technically recoverable reserves of which in 2013 were 1 115.2 Tcf [9], and the reserves of shale (tight) oil were estimated at 32.2 billion barrels (3rd place in the world, after the USA and Russia) [9]. In the World Energy Council report from 2008, reserves of kerogen oil were estimated at 354 430 million barrels, and the reserves of extra-heavy oil at 750 million barrels [10]. China, owning to its geographic location, has a variety of renewable sources for energy production. A selection of basic indicators of this type of resource is presented in Table 2. The level of direct solar irradiation for the majority of the country is between 4.1-4.7 kWh/m2/day [11]. In the southwest of the country, in the Tibet region, as well as on the border with India, Nepal and Bhutan, this indicator can reach 5.7-6.3 kWh/m2/day [11].
The distribution of wind resources is as follows: for the majority of the country at a height of 50 m wind speed does not exceed 6.5 m/sec, but in the southwest of Fujian Province; in the provinces of Xizang and Xinjiang wind speed can reach a maximum of 8.75 m/sec [12].
Table 2. Renewable energy resources of China
| Resource/ Explanations | Solar Potential (GHI)* | Wind Potential (50 м)* | Hydro energy Potential** | Bio Potential (agricultural area) | Bio Potential (forest area) | Geothermal Potenial | Municipal Solid Waste |
|---|---|---|---|---|---|---|---|
| Value | 4.1-4.7 | <6.5 | 2 140 000 | 54.7 | 22.3 | 6 744 | 1.02 |
| Unit | kWh/m2/day | m/s | GWh/year | % of land area | % of land area | MWe | Kg/day/per capita |
| Year | 2018 | 2018 | 2016 | 2018 | 2018 | 2008 | 2012 |
| Source | [11] | [12] | [13] | [15] | [16] | [17] | [18] |
*for the majority of the territory of the country
**economically exploitable capability
At 2,140,000 GWh/year China has the second largest hydropower potential in the world, after Russia. In 2016, 41% of this potential is being utilized [13]. The wave energy potential on the coast of the South China Sea can reach 10-15 kW/m per year [14]. According to data for 2018, 54.7% of the territory of the country is occupied by agricultural land, the area of which has been steadily increasing during the last half-century [15]. There has also been a slight increase in forest area, to 22.3% of the country's territory [16]. China is one of the world leaders in the total area of forests and agricultural land, and in the production of sawn wood and livestock, which is a rich resource for the development of bioenergy. The geothermal potential of the country, according to the 2016 Annual U.S. & Global Geothermal Power Production Report, was estimated at 6 744 MW [17]. In 2012, the level of municipal waste generation in China was 1.02 kg per capita per day, lower than in Japan (1.71 kg per capita per day) and South Korea (1.24 kg per capita per day). By 2025 this index is projected to grow to a level of 1.7 kg per capita per day [18]. This resource is a valuable raw material for recycling or energy production, the technologies of which are being actively developed in China.
Energy Balance
According to the BP Statistical Review of World Energy 2021, primary energy consumption in China in 2020 amounted to 145.46 Exajoules and was dominated by coal – 82.27, followed by oil – 28.5, hydroenergy – 11.74, natural gas – 11.9, renewable energy - 7.79 and nuclear power – 3.25 [6]. An estimated value of the energy intensity of GDP in China, based on data from [3,6], was $7.4 in 2018, taking into account the PPP in 2011 prices per unit of energy expended (the equivalent of energy contained in one kg of oil), which is lower than the world average.
Production of oil between 2001 and 2019 increased gradually, and in 2019 reached 4 934 thousand barrels/day (Fig.2) [19]. The volume of consumption grew about three times between 2001 and 2019, reaching 14 008 thousand barrels/day in 2019 [19]. According to BP and the U.S. Central Intelligence Agency, China was one of the top 10 oil producers and was the second largest oil consumer globally, with oil production at 3 901 thousand barrels/day, and oil consumption at 14 225 thousand barrels/day [6]. It is also worth noting that the country was the second largest importer of oil (6.71 million bbl/day) in 2015, according to [3]. The main exporters of oil to China are the Middle East, as well as Angola and Russia [20]. China is also among the top ten countries in terms of consumption and production of natural gas [3]. The production of natural gas in China has been gradually increasing since 2001 and reached 6 333 Bcf in 2019, while consumption in this period grew at a rapid pace and in 2019 reached 10 827 Bcf [19]. According to the BP Statistical Review of World Energy 2021 [6], gas consumption in the country was 330.6 billion m3 in 2020, while production was 194 billion m3.
Source: U.S. Energy Information Administration (Sep 2023) / www.eia.gov
Figure 2. The production and consumption of fossil fuels in China (coal – left, gas – in the center, oil – right)
In 2017, China overtook South Korea to become the second largest LNG importer after Japan. LNG imports increased to 2.9 Tcf in 2019, up 13% from 2018 levels [20]. The main suppliers of LNG are Qatar, Australia, Malaysia, and Indonesia. In 2018, deliveries of liquefied gas from Russia started from the new export terminal on the Yamal Peninsula along the Northern Sea Route. Source [3] provides data on the import and export of natural gas, which amounted to 97.63 billion m3 and 3.37 billion m3, respectively.
China is the largest consumer and producer of coal, and the country's share in world coal consumption is about 50% [20]. Coal production in the country has been growing since 2001 and in 2013 reached a maximum of 4 380 million short tons; it subsequently slightly declined, totalling 3 797 million short tons in 2017, and 4 280 in 2019. Coal consumption also increased and in 2013 reached 4 678 million short tons, before decreasing to 4 210 by 2017, and to 4 604 in 2019 [19]. According to BP, in 2020, coal consumption totalled 82.27 Exajoules, while production was 80.91 Exajoules [6]. In recent years there has been a gradual increase in the share of renewable energy sources and a decrease in the share of fossil fuels in China (Fig. 3).
| Sources: U.S. Energy Information Administration (Sep 2023) / www.eia.gov Figure 3. Electricity production in China |
In 2020, according to the U.S. Energy Information Administration, electricity generation amounted to 7 601 TWh and was dominated by fossil fuels – 66.1%, followed by hydropower – 17.7%, renewable sources – 11.4%, and nuclear power – 4.8%, (Fig.9). China’s position in the comparative diagram of energy index is shown in Figure 4.
| Sources: 1. Crude oil proved reserves, 2021 / International Energy Statistic/Geography / U.S. Energy Information Administration (Nov 2021)*98 2. Natural gas proved reserves 2021 / International Energy Statistic / Geography / U.S. Energy Information Administration (Nov 2021) *99 3. Total recoverable coal reserves 2019 / International Energy Statistic / Geography / U.S. Energy Information Administration (Nov 2021) *81 4. Combination production-consumption for Crude oil 2018 / International Energy Statistic / Geography / U.S. Energy Information Administration (Nov 2021) *219 5. Combination production-consumption for Natural gas 2019 / International Energy Statistic / Geography / U.S. Energy Information Administration (Nov 2021) *123 6. Combination production-consumption for Coal 2019 / International Energy Statistic / Geography / U.S. Energy Information Administration (Nov 2021) *128 7. Electricity – from other renewable sources (% of total installed capacity), 2017 est. / The World Factbook / Library / Central Intelligence Agency *170 8. GDP per unit of energy use (PPP per unit of oil equivalent), 2020 *66 Primary energy consumption - BP Statistical Review of World Energy 2021/BP;GDP (purchasing power parity) - The World Factbook/Library/Central Intelligence Agency 9. Energy use (primary energy use of oil equivalent per capita) 2020 *127 Primary energy consumption – BP Statistical Review of World Energy 2021; Population - United Nations, Department of Economic and Social Affairs, Population Division (2019). World Population Prospects 2019, custom data acquired via website. Retrieved 15 November 2021*66 10. The Global Energy Architecture Performance Index Report (EAPI) 2017 / Rankings / Reports / World Economic Forum 11. Electric power consumption (kWh per capita), 2016 *217 Electricity Consumption - The World Factbook / Library / Central Intelligence Agency; Population - United Nations, Department of Economic and Social Affairs, Population Division (2019). World Population Prospects 2019, custom data acquired via website. Retrieved 15 November 2021 12. Combination of electricity production-consumption (kWh)/The World Factbook/Library/Central Intelligence Agency *216 * Total number of countries participating in ranking Figure 4. Energy indices of China |
As previously mentioned China possesses exceptionally rich reserves of all types of fossil fuels, and in terms of the production and consumption ratio of coal is among the 25% leading countries. At the same time, the production and consumption ratio of oil and gas is below the world average. In terms of the share of electricity production from renewable energy sources (excluding hydropower), China was 46th out of 170 countries in 2017.
China was 95th in the EAPI of 2017 (Energy Architecture Performance Index), which is based primarily on the level of economic growth, environmental safety, and energy independence of the country, including access to energy. Over the last 8 years the country has lost one position in the rating. China was below the world average in terms of GDP per unit of energy use in 2020 – 51st out of 66 countries considered, but places higher by this indicator per capita – 36th place.
In terms of electric power consumption per capita, China is 71st out of 216 countries considered. In terms of combined of electricity production - consumption, the country at the very top of the rating.
Energy Infrastructure
A territorial map showing the distribution of the largest infrastructure projects of the fossil fuel sector in China is shown in Figure 5. The proven reserves of coal account for 91.3% of total fossil fuel resources, followed by natural gas – 5.5%, and oil – 3.2% (Fig.5).
The largest reserves of crude oil in China come from Daqing, developed by PetroChina. The production in 2017 was 680,000 barrels/day [21]. In 2021, 140 Chinese refineries had a total installed capacity of 12.5 million barrels/day [22]. The country's largest refinery is Zhenhai, owned by Sinopec, with an installed capacity of 23 million tons per year [23] (Fig.5).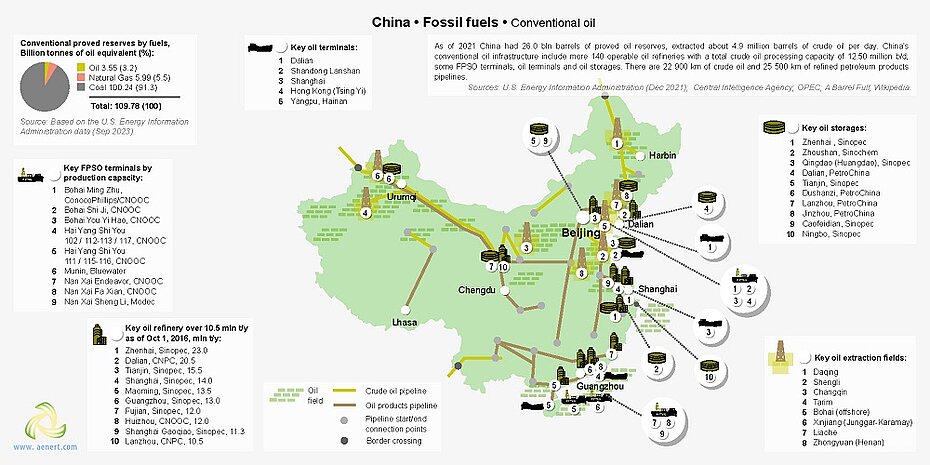
Figure 5. Basic infrastructure facilities of the fossil fuel sector China: conventional oil
The import of oil and oil products is carried out through 5 key oil terminals, and the largest oil storage is also Zhenhai (32.7 mln. bbl). The total installed capacity of oil storage facilities in the country is 103.1 million barrels [24]. Transportation of oil and oil products is carried out through pipelines with a total length of 22,900 km and 25,500 respectively (Fig.5). It is important to note that the western and eastern regions of the country, which have different resource opportunities, are connected by pipelines. Oil production and storage are also carried out through FPSO, the largest of which is Bohai Ming Zhu of ConocoPhillips/CNOOC. The installed capacity of FPSO Bohai Ming Zhu in oil production is 80,000 bpd, gas production is at the level of 6 MMscfd, the storage capacity is 1,000 MBBLs [25,26].
Natural gas extraction fields in China are mainly located in the east of the country. Other gas production centres are located in the north-western and central regions of China. One of the major gas fields of the country is Sulige (Fig.6). According to estimates of Chinese specialists, the level of extraction from the field in 2017 was 23.0 bln cbm/year [27]. Gas is transported within the country via a network of pipelines with a total length of 70,000 km, and stored in 25 underground gas storage facilities (Fig. 6).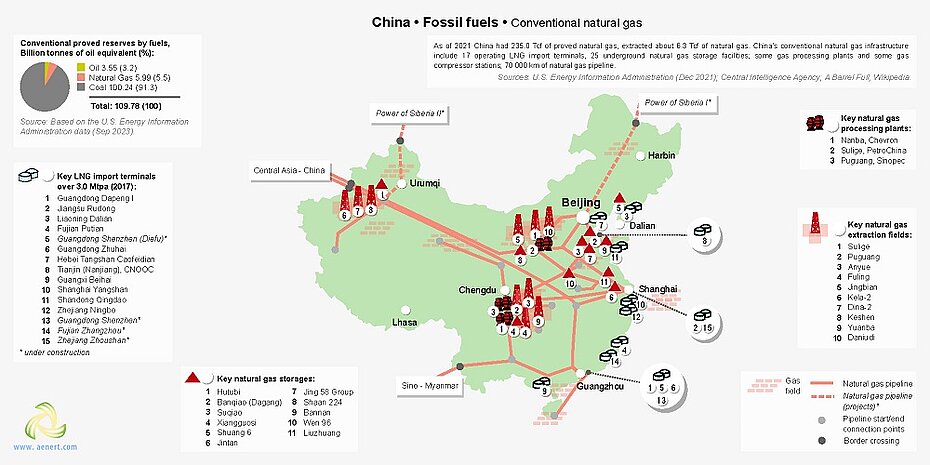
Figure 6. Basic infrastructure facilities of the fossil fuel sector in China: conventional natural gas
Gas is imported via 21 LNG terminals, the largest is Guangdong Dapeng I with a throughput of 6.8 MTPA (million tonnes/year) [28]. The largest gas storage facility is Hutubi which is capable of storing 10.70 Bcm of gas [29]. At the end of 2017, the construction of the second line of the Skovorodino-Daqing oil pipeline was completed on Chinese territory, which increased the supply of oil from Russia via this pipeline to 30 million tons per year. In addition, in 2010 China requested Rosneft to increase oil deliveries by rail through Kazakhstan from 10 to 13 million tons per year. In December 2019, deliveries of natural gas from Russia started via the "The Power of Siberia" gas pipeline, with a capacity of 61 billion cubic metres per year. The gas is mainly supplied from Chayandinskoye in Russia, and development of the Kovykta field in Eastern Siberia is also planned. It has already been mentioned that in 2018, liquefied gas supplies from Russia were launched from the new terminal on the Yamal Peninsula along the Northern Sea Route. China, in addition to receiving an increased supply of oil and gas from Russia, is actively participating in shared ownership and investment in the development of Russian oil and gas fields. Thus, Russia is becoming one of China's main energy partners. According to IEA estimates, in 2023 China will become the main consumer of natural gas in the world with an annual volume of around 170 Bcm, or 37% of the world's total consumption.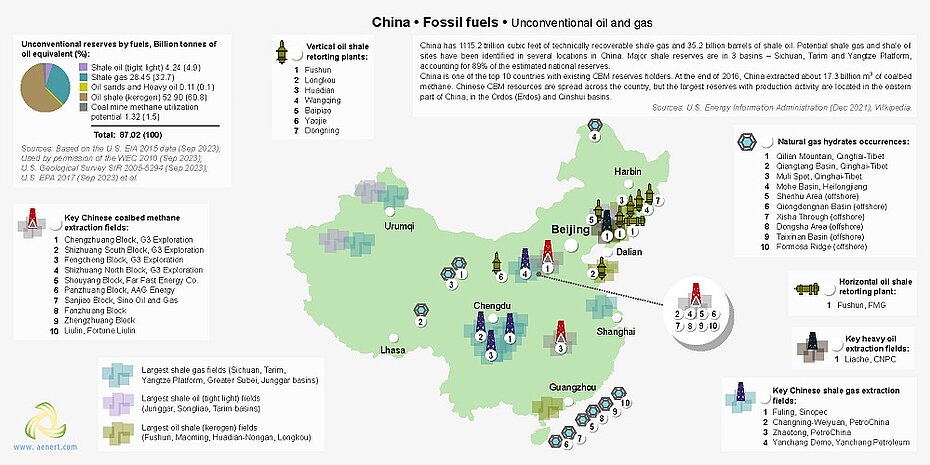
Figure 7. Basic infrastructure facilities of the fossil fuel sector in China: unconventional oil and gas fields
The main extraction fields of kerogen oil are located in 4 Chinese provinces and 5 cities: Liaoning (Fushun), Guangdong (Maoming), Jilin (Huadian and Nonang), Shandong (Longkou) [30].
The processing infrastructure of kerogen oil is represented by several vertical and horizontal retorting plants (Fig.7). The main potential deposits of shale gas and shale oil are located in 3 basins – the Sichuan, Tarim and Yangjing basins, which account for 89% of the estimated national reserves [31,32]. The largest shale gas field is Fuling, developed by Sinopec; in 2017 production was at the level of 6.0 bln cbm/year [33]. There are also heavy oil fields on Chinese territory; around 10.2 mln tonnes were extracted from the Liaohe field in 2014 [34]. China is the world's second largest producer of coal mine methane in the world. In the central part of the country methane coal seams are disposed of in several large coal deposits (Fig.7). In 2015 and 2016, the volume of production of this gas was 18 and 17.3 Bcm, respectively. The government plans to increase this figure to 24 Bcm per year, and also to increase the level of reasonable use of mine gas in the energy sector, bringing it to no less than 66% [35].
One of the most promising trends in the development of China's gas industry, judging by the explosive growth of theoretical and experimental research, is the development of industrial technologies for the production of gas hydrates. Studies of gas hydrates are carried out in many regions of the country, but the main development base of industrial technologies is the South China Sea (Fig.7). According to reports in the Chinese press in 2017, successful industrial tests have been conducted, which predict the commercial production of gas hydrates by 2030 with a high probability [36]. This has the potential to dramatically change the energy picture not only in China, but globally. China, following developments in South Africa, is actively developing technologies for coal gasification and the production of liquid hydrocarbons. The Coal-to-Liquids processing infrastructure is represented by a number of enterprises in Inner Mongolia, the leading example being Ordos (Shenhua Group), with an installed capacity of 24,000 barrels/day (bpd [37] (Fig. 8). Coal gasification technology is represented by the Ulan Qab (Wulanchabu) facility, with a capacity of 5 MW [38]. Around 14 gasification stations in the central part of the country, as well as in Inner Mongolia, are also under construction.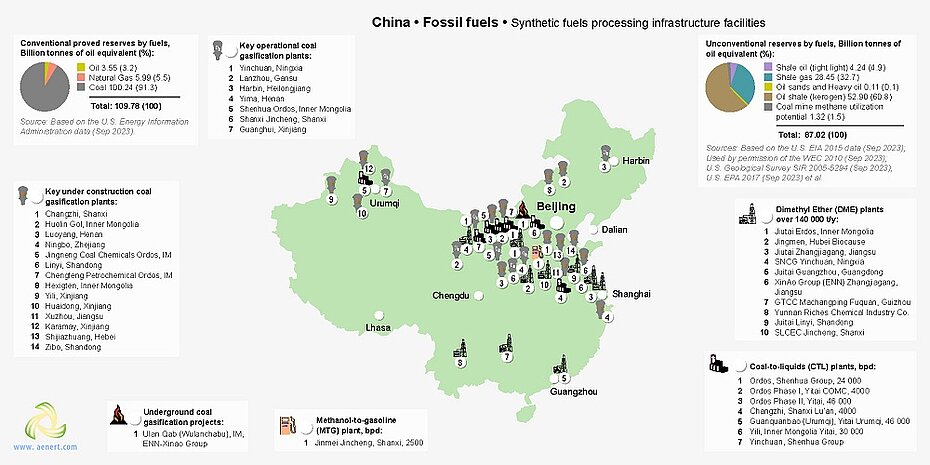
Figure 8. Basic infrastructure facilities of the fossil fuel sector in China: synthetic fuels processing infrastructure facility
China is the world's leading producer of methanol; the share of China in the world's production is slightly under 50%. The main purpose of methanol is its further use in the production of chemical products, mainly fertilizers. However, it is also used in electrical engineering for the production of various fuels, principally dimethylether. Among the methanol production and processing facilities, the JiutaiErdos DME plant in inner Mongolia should be mentioned, with an installed capacity of 1 million tons of methanol per year [39], and Jincheng MTG Plant, Jincheng Anthracite Mining Co., Ltd, with an installed capacity of 300,000 t/a methanol and 2500 bbl/d of gasoline [40] (Fig. 8).
A map showing the territorial distribution of Chinese infrastructure facilities for electricity generation is presented in Figure 9.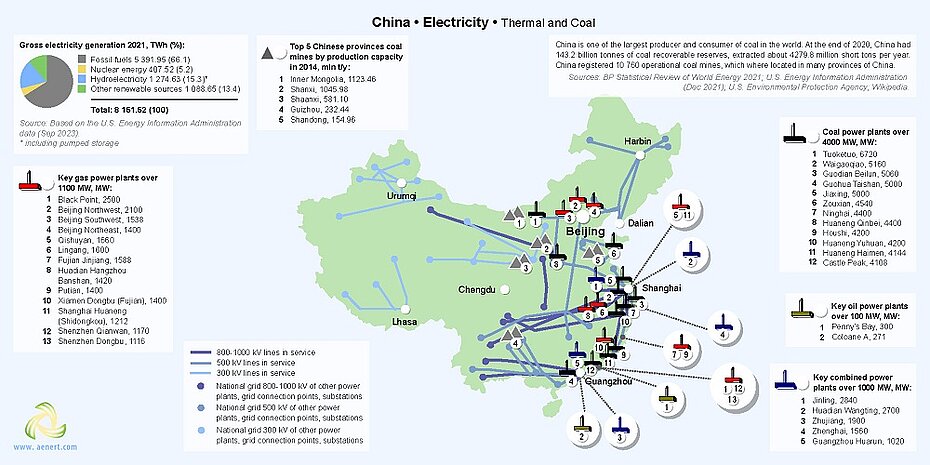
Figure 9. Electricity production in China: thermal and coal power plants
As already noted, the share of coal in the potential of fossil resources is significant. In total there are more than 10 760 coal mines in the country, producing around 4 279.8 million short tons annually (Fig.9).
Coal mines are mainly concentrated in the central and north-eastern part of the country. Inner Mongolia has the richest coal resource base; coal mining in this region totalled 1 123.46 mln t/year in 2014 [41]. According to the U.S. Energy Information Administration, the share of fossil hydrocarbon resources in power generation in China in 2020 was 66.1% (Fig.9). China has a significant number of stations for the production of electricity from hydrocarbons, including power plants with a capacity of more than 1,000 MW: four oil, eleven gas, eleven coal and six combined type power plants (Fig.9).
The largest power generating facilities in China are: Black Point gas power plant with a capacity of 2,500 MW [42]; Penny’s Bay oil power plant, with installed capacity of 300 MW [43]; Datang Tuoketuo, one of the world's largest coal power plants, with an installed capacity of 6,720 MW; and Jinling combined type power plant with an installed capacity of 2840 MW [44,45].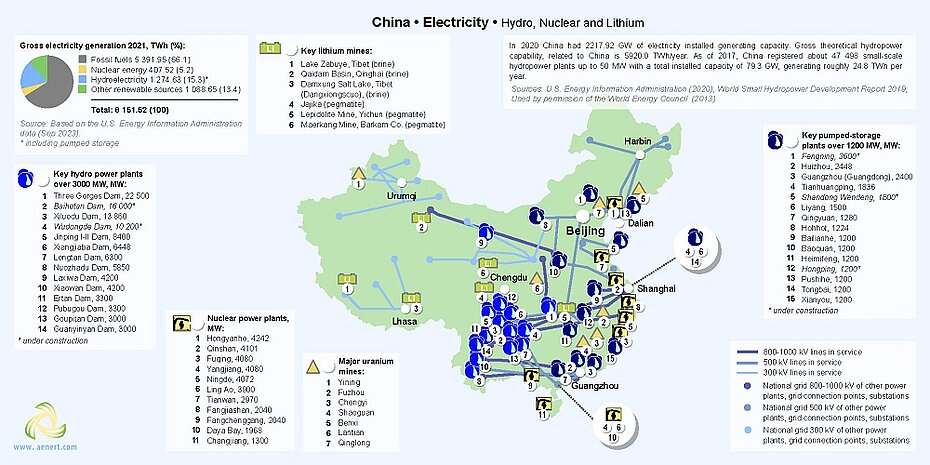
Figure 10. Electricity production in China: hydro and nuclear power plants, lithium
Hydropower in China produces about 17.7% of the country’s electricity generation, and is represented by pumped storage plants, and large and small hydroelectric plants (Fig. 10). The Three Gorges Dam is the largest hydropower plant in the world, and has an installed capacity of 22,500 MW [46]. China is also home to the largest pumped storage plant in the world; Fengning has an installed capacity of 3,600 MW. It was put into operation in 2021 [47]. In total more than 47,000 small hydropower stations were registered in the country in 2017, the total installed capacity of which was 79.3 GW (Fig.10). In recent years, China build a large number of new stations, including the Baihetan Dam (16,000 MW), the Wudongde Dam (10,200 MW), and the Maerdang Dam (2,200 MW). The main uranium mines are located in the east of the country. The largest is Yining, from which 480 tU/year of raw materials in 2016 [48].
Nuclear power in the country is represented by 16 nuclear power plants, which produce around 4.8% of China’s electricity generation (Fig.10). The largest station of this type is Hongyanhe with an installed capacity of 4,242 megawatts [49]. Since 2004 China has shown a downward trend in the annual growth of electricity consumption. At the same time, the government of China has approved several changes in the energy sector. First, there will be a significant reduction in coal consumption, for example, it is planned to reduce consumption in some regions in the east of the country, including the capital region, by 10%, and in the delta region of the Yangzi River by 5%. Other development prospects are related to the active development of the nuclear industry. By 2030 it is planned to increase the total capacity of nuclear power plants to 130 GW. Since 2004 the salt mine near Lake Zabuye, in the Shigatse Prefecture of the Tibet Autonomous Region, has been producing lithium. In 2008, Zhabuye Lithium produced 1.556.5 tonnes of lithium carbonate and was the main source of lithium in China [50].
In Figure 11, you can see the main facilities of China for the production of energy from renewable sources.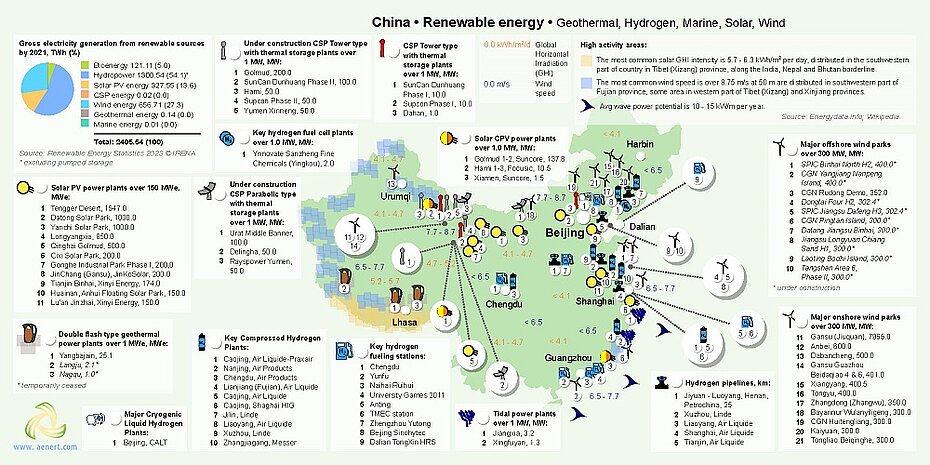
Figure 11. Renewable energy in China: geothermal, hydrogen, marine, solar, wind
As noted above, renewable energy in China, excluding hydropower, has around an 11.4% share in electricity generation. Thus, the total production of electricity from renewable sources, excluding hydropower, in 2017 was 865.29 TWh (Fig.11). In zones of high wind activity there are around twenty large offshore and onshore wind farms, each with a capacity of more than 300 MW. One of the largest offshore wind farms is the SPIC Binhai North H2, which an installed capacity of 400 MW [51]. The leading onshore wind farm is Gansu (Jiuquan) with an installed capacity of 7.965 MW, which is planned to be increased to 20,000 MW [52]. According to GWEC [56], in 2020 China installed half of all new global offshore wind capacity. China has an installed 288,32 MW of cumulative wind turbine capacity (39% in the onshore global share and 28% of the global installations offshore) and was also the world leader in installing new offshore facilities in 2020 – 24.6 GW (56%), outperforming its closest competitors the USA with 7,8 GW. China also holds the world lead in the number of new annual offshore wind installations for the third consecutive year with more than 3 GW of new offshore wind in 2020.
As previously mentioned, the level of solar radiation in some areas of the country can reach 5.7 kWh/m2/day, which is a sufficient resource for energy production [10]. As a result, there are a number of solar energy facilities installed in these areas, including PV power plants, CPV and CSP power plants (Fig.11). Thus, the five largest PV stations in the world include the Chinese Tengger Desert Solar Park Plant with a capacity of 1,547 MW, Datong Solar Power Top Runner (1000 MW), and Base Longyangxia Dam Solar Park (850 MW). The leading CPV installation in the country is Golmud 1-2, Suncore with a capacity of 137.8 MW [54,55,56]. Among parabolic type CSP stations, the largest is Urat Middle Banner, with a capacity of 100 MW [57], and among the existing tower-type stations with a thermal storage the largest are SunCan Dunhuang Phase I with a capacity of 10 MW [58], and Golmud which is currently under construction, and will have a capacity of 200 MW [59]. In addition, Chinese companies are leading the world market in both the production of poly and monocrystalline silicon, which is the basic element for the production of solar panels, as well as the panels themselves. Among these companies are global industry leaders including Trina Solar (China), JinkoSolar (China), JA Solar (China), GCL and LONGi Solar. It should also be noted that China is the world leader in the installation of solar water heating systems (solar water heating); China possesses about 70% of all installed capacities in the world.
The wave energy potential in the coastal areas of China can reach 10-15 kWh, as a result, there is a number of tidal power stations installed, including the Jiangxia Tidal Power Plant with an installed capacity of 3.2 MW [60]. To dispose of the geothermal potential of China, which was estimated at 9,057 MW in 2008 [24], various technologies are used, including Double flash type stations, such as Yangbajain with an installed capacity of 25.1 MW [61]. China actively develops hydrogen power as a source of energy for vehicles. There are hydrogen production facilities in the country, the largest of which is Caojing (Air Liquide-Praxair), with an installed capacity of 185,000 Nm³/hr [62] and Ynnovate Sanzheng Fine Chemicals (Yingkou) Hydrogen Fuel Cell plants with an installed capacity of 2 MW [63]. As of May 2018, there were 8 hydrogen filling stations in operation in the country [64]. Hydrogen is transported via 5 small pipelines (Fig.11) [65]. In January 2018, the Hydrogenics Corporation received a contract for the supply of fuel cell power systems for zero-emission vehicles with a total value of $ 7.8 million [66].
Figure 12 shows the main bioenergy facilities for energy production.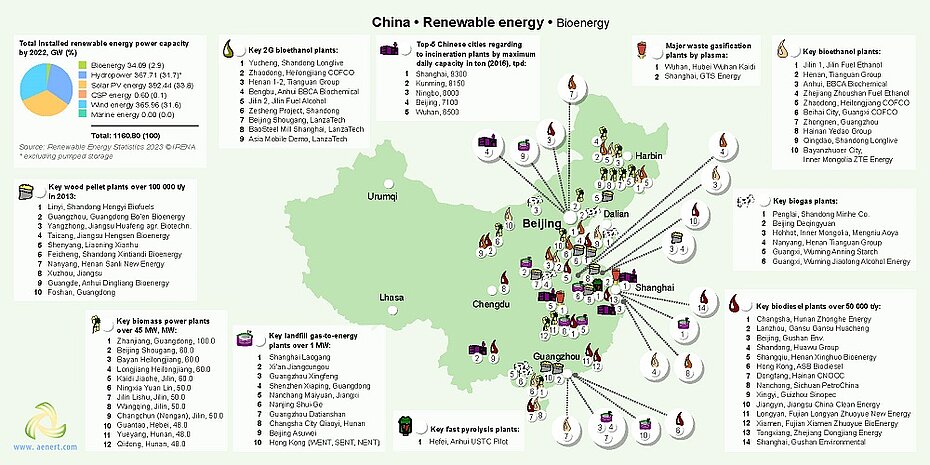
Figure 12. Renewable energy in China: Bioenergy
According to IRENA in 2020, the installed capacity of renewable energy in the country was 894.87 GWe, where the share of bioenergy was about 2.1% [67]. The country has biomass and municipal waste processing plants, biodiesel, and pellet production, etc. (Fig. 12).
The main enterprise for the production of fuels from biomass is Changsha, Hunan Zhonghe Energy Biodiesel Plant with an installed capacity of 500,000 t/year [68]. Sovren Biomass Co. is the operator of the largest Zhanjiang biomass production plant, capable of producing 100,000 tons of raw materials per year [69]. China is actively engaged in the production of bioethanol, and Jilin 1 can produce about 600,000 tons per year [70]. Second-generation bioethanol from cellulose is produced at the Yucheng plant, which has an installed capacity of 60,000 t/ year [71]. The largest biogas plant in the country is Penglai with an installed capacity of 3 MW [72]. China is one of the world leaders in biogas production, along with the US and Germany. Among other enterprises, it is worth mentioning the Hefei, Anhui USTC Pilot Pyrolysis Plant with a capacity of 120 kg/hour of bio-oil [73]; Biomass to Liquid Fuels Demonstration Facility Wuhan [74]; and Hongyi Biofuels in Linyi, which can produce 200,000 tons of pellets annually [75].
The leader among Chinese cities in the generation of electricity from municipal waste is Shanghai, whose enterprises can process 9,300 tons per day [76]. Shanghai Laogang generates about 15 MW of electricity from landfill gas [77]. In 2017, the National Development and Reform Commission (NDRC) and the National Energy Administration (NEA) published the Energy Supply and Consumption Revolution Strategy (2016-2030), continuing the Five Year Plan for energy (2016-2020). One of the priorities of the country's energy strategy is the development of renewable energy sources in the country, and $360 billion will be allocated for this purpose [78]. China’s renewables consumption grew by 15% in 2020, whereby renewables, including hydropower, account for only 5.4% in energy consumption mix [79]. According to data from the China Statistical Bureau, between 2015 and 2016, the growth of electricity generated by solar energy was 57.1% [80]. However, it should be noted that China is considering the possibility of refusing government subsidies for supporting renewable energy. As for fossil energy sources, it is worth noting the reduction in the growth rates of production volumes to 3.9 billion tons in 2020 (0.8% over the five-year period) and consumption to 4.1 billion tonnes (0.7%). Forecasts that due to the closure of obsolete coal industry infrastructure facilities, there would also be a decline in production capacity to 0.8 billion tons per year have not been realized, and according to the National Bureau of Statistics, China produced 395.79 million tonnes of coal in March 2022 [81, 82].
Education and Innovation
The set of indices reflecting the position of China among other countries in the field of education and innovation can be seen in Figure 13. It can be seen from the diagram that China has a very high level of academic achievement. According to the Global Innovation Index 2021, China is ranked 12th out of 132 countries (see diagram).
According to the number of patents granted to Chinese nationals, both domestically and abroad, the country ranks 2nd in the world, after Japan and the U.S. By the number of patents in force, the country is 3rd in the world, indicating the country’s favorable conditions for innovation. China is very well positioned when considering the number of publications of specialists in scientific and technological journal and patent activities. The country is 2nd only to the U.S. in the Scimago ranking, and in Scientific and Technical Journal Activities it is ranked 1st out of 197 countries; 58 Chinese universities are included in the rating of the world leading universities: the “QS University Rating”.
| Sources: 1. The Global Innovation Index 2021, Rankings / Knowledge / World Intellectual Property Organization / Cornell University, INSEAD, and WIPO (2021): Energizing the World with Innovation. Ithaca, Fontainebleau, and Geneva *132 2. Patent Grants 2011-2020, resident & abroad / Statistical country profiles / World Intellectual Property Organization *185 3.Patents in Force 2020 / Statistical country profiles / World Intellectual Property Organization *109 4. QS World University Rankings 2022 *97 5. SCImago Country Rankings (1996-2020) / Country rankings / SCImago, (n.d.). SIR-SCImago Journal & Country Rank [Portal]. Retrieved 17 Nov 2021 *240 6. Internet users in 2018 / The World Factbook / Central Intelligence Agency *229 7. Internet users in 2018 (% Population) / The World Factbook / Central Intelligence Agency *229 8. Government expenditure on education, total (% of GDP), 2019 / United Nations Educational, Scientific, and Cultural Organization (UNESCO) Institute for Statistics. License: CCBY-4.0 / Data as of September 2021*177 9. Research and development expenditure (% of GDP), 2018 / UNESCO Institute for Statistics. License: CCBY-4.0 / Data *119 10. Scientific and technical journal articles, 2018 / National Science Foundation, Science and Engineering Indicators. License: CCBY-4.0 / Data *197 * Total number of countries participating in ranking Figure 13. The indices of education and innovation in China |
Chinese universities such as Peking University, Tsinghua University, Beijing University of Chemical Technology, Beijing Jiaotong University, the National University of Defense Technology, Central South University, Zhengzhou University, Beijing University of Technology, and Yunnan University, train specialists in various fields of energy, including Environmental Engineering, Agricultural Biological Environmental and Energy Engineering, etc.
In the field of synthetic fuel technology, Sinopec, Wuhan Kaidi Engineering Technology Research General Insitute Co., Ltd, Sinopec Research Institute of Petroleum Engineering, and Shenhua Group Co.,Ltd actively patent their inventions. Research in this area is carried out by the CAS ICC Institute of Coal Chemistry, ECUST East China University of Science & Technology, CUMT China University of Mining and Technology.
In the field of unconventional oil, Sinopec, PetroChina Company Limited, Beijing Junlun Runzhong Science & Technology Co. Ltd, Fushun Mining Group Co., Ltd, CNOOC China National Offshore Oil Corporation lead by number of patents. Studies in this area are conducted by UPC China University of Petroleum, PetroChina Company Limited, JLU Jilin University, NEPU Northeast Petroleum University.
In the sector of associated petroleum gas, the largest number of inventions is registered by Synfuels China Technology Co., Ltd, Xi’an Changging Technology Engineering Co., Ltd, CNOOC China National Offshore Oil Corporation. SWPU Southwest Petroleum University, PetroChina Company Limited, and CNOOC China National Offshore Oil actively publish scientific works in this field.
CUMT China University of Mining and Technology, PetroChina Company Limited, UPC China University of Petroleum, HPU Henan Polytechnic University are leading in the number of patents in coalbed methane mining technologies, and studies are conducted by COGB China University of Geosciences. In the field of hydrocarbon production from low-permeability reservoirs, the absolute leaders in patenting are PetroChina Company Limited, Sinopec, CNPC CCDC Chuanging Drilling Engineering Company Limited, South West Petroleum University,. Studies are conducted by the UPC China University of Petroleum, PetroChina Company Limited, PetroChina Research Institute of Petroleum Exploration and Development, and SWPU Southwest Petroleum University.
CAS GIEC Guangzhou Institute of Energy Conversion, DLUT Dalian University of Technology patent their developments in the field of gas hydrate production technologies. CUGB China University of Geosciences, Gunagzhou Marine Geological Survey, CAS GIEC Guangzhou Institute of Energy Conversion, UPC China University of Petroleum actively publish scientific works in this field.
Patents in bioenergetic technologies are possessed by Wuhan Kaidi Engineering Technology Research Research General Insititute Co., Ltd, Sunshine Kaidi New Energy Group Co. Ltd, CAS GIEC Guangzhou Institute of Energy Conversion, and SEU Southeast University. Scientific research in the same field is conducted by the UCAS University of Chinese Academy of Sciencem CAS QIBEBT Qingdao Institute of Bioenergy and Bioprocess Technology, Zhejiang University, TJU Tianjin University.
A large number of companies patent inventions and conduct research in the field of renewable energy technologies. In the field of solar energy – Chengdu Juhe Technology Co. Ltd, Wuhan Kaidi Engineering Technology Research General Institute Co., Ltd., THU Tsinghua University, Xiangtan Electric Manufacturing Co., Ltd. NCEPU North China Electric Power University, and Shanghai Jiao Tong University lead by their numbers of patents. Inventions in the field of wind energy are patented by Sinovel Wind Group Co Ltd, State Grid Corporation of China, Geijing Goldwind Science & Creation Windpower Equipment Co Ltd, and research is conducted by the NCEPU North China Electric Power University, Shanghai Jiao Tong University, China Electric Power Research Institute, CQU Chongging University.
Ecology and Environment Protection
The environmental indices shown in Figure 14 represent to some extent the ecological situation in the country, which in the case of China is quite negative. The country demonstrates a relatively high level of CO2 emissions both in general, and per capita. It is also necessary to note the very high level of methane emissions in the country. China ranks 37th in the Climate Change Performance Index (CCPI) 2022, which includes the 61 countries responsible for more than 90% of global energy-related CO2 emissions. The compilers of the ratings gave China a "low" rating, based on the fact that China is the world's largest emitter of GHG emissions, but the experts regard country’s climate policy as ambitious, with clear policies and timelines. In terms of forest area as a percentage of the country, China in 2020 was 137th out of 234; however, the trend associated with its change from 2010-2020 looks very positive, the country is the world leader.
However, in the Environmental Performance Index rankings (EPI-2020), which focuses primarily on assessing the environmental performance of national governments, strategies aimed at reducing the negative impact of the environment, and the rational use of natural resources, the country was 120th out of 180 countries in 2020.
| Sources: 1. CO2 total emission by countries 2020 / European Commission / Joint Research Centre (JRC) / Emission Database for Global Atmospheric Research (EDGAR)*208 2. CO2 per capita emission 2020/European Commission/Joint Research Centre (JRC) / Emission Database for Global Atmospheric Research (EDGAR) *208 3. Forest area 2020 (% of land area) / The Global Forest Resources Assessment 2020 / Food and Agriculture Organization of the United Nations *234 4. Forest area change 2010-2020 (1000 ha/year) / The Global Forest Resources Assessment 2020 / Food and Agriculture Organization of the United Nations *234 5. The Environmental Performance Index (EPI) 2020 / Rankings / Yale Center for Environmental Law & Policy / Yale University *180 6. Annual freshwater withdrawals (m3 per capita), 2017 *179 Annual freshwater withdrawals, total (billion m3), 2017 – Food and Agriculture Organization, AQUASTAT data. /License: CC BY-4.0; Population – United Nations, Department of Economic and Social Affairs, Population Division (2019). World Population Prospects 2019, custom data acquired via website. Retrieved 15 November 2021 7. The National Footprint Accounts 2017 (Biocapacity Credit / Deficit) / Global Footprint Network *188 8. Methane emissions (kt of CO2 equivalent), 2018 / Data for up to 1990 are sourced from Carbon Dioxide Information Analysis Center, Environmental Sciences Division, Oak Ridge National Laboratory, Tennessee, United States. Data from 1990 are CAIT data: Climate Watch. 2020. GHG Emissions. Washington, DC: World Resources Institute. Available at: License : Attribution-NonCommercial 4.0 International (CC BY-NC 4.0) *191 9. The Climate Change Performance Index (CCPI) 2022 / Overall Results / Jan Burck, Thea Uhlich, Christoph Bals, Niklas Höhne, Leonardo Nascimento / Germanwatch, NewClimate Institute & Climate Action Network *60 * Total number of countries participating in ranking Figure 14. China’s environmental indices |
The overall negative picture is aggravated by the Ecological Footprint Atlas rating, according to which China is among a number of major ecological debtors.
References
[1] List of countries and dependencies by area / Wikipedia / https://en.wikipedia.org/wiki/List_of_countries_and_dependencies_by_area
[2] List of countries and territories by population density / Wikipedia / https://en.wikipedia.org/wiki/List_of_countries_and_territories_by_population_density
[3] China / The World Factbook / Central Intelligence Agency / https://www.cia.gov/library/publications/the-world-factbook/geos/ch.htm
[4] GDP, PPP (constant 2011 international $) / The World Bank / https://data.worldbank.org/indicator/NY.GDP.MKTP.PP.KD?locations=CN
[5] GDP per capita, PPP (current international $) / The World Bank / https://data.worldbank.org/indicator/NY.GDP.PCAP.PP.CD?locations=CN&view=chart
[6] BP Statistical Review of World Energy June 2021 (PDF) / BP / https://www.bp.com
[7] Energy Study 2017 (PDF) / Bundesanstalt für Geowissenschaften und Rohstoffe (BGR) / www.bgr.bund.de
[8] 2006 IPCC Guidelines for National Greenhouse Gas Inventories, Volume 2, Energy, Fugitive Emissions (PDF) / The Intergovernmental Panel on Climate Change (IPCC) / www.ipcc-nggip.iges.or.jp
[9]World Shale Resource Assessments / U.S. Energy Information Administration (September 24, 2015 )/ www.eia.gov
[10] 2010 Survey of Energy Resources (PDF)/ World Energy Council / www.worldenergy.org
[11] Solar resource data obtained from the Global Solar Atlas, owned by the World Bank Group and provided by Solargis / Global Solar Atlas / globalsolaratlas.info
[12] Wind Map / Global Wind Atlas 2.0, a free, web-based application developed, owned and operated by the Technical University of Denmark (DTU) in partnership with the World Bank Group, utilizing data provided by Vortex, with funding provided by the Energy Sector Management Assistance Program (ESMAP). For additional information: globalwindatlas.info
[13] World Energy Resources Hydropower 2016 (PDF) / World Energy Council / www.worldenergy.org
[14] World wave energy resource map / Wikipedia / en.wikipedia.org/wiki/Wave_power
[15] Agricultural land (% of land area) /Food and Agriculture Organization, electronic files and web site. License: CC BY-4.0 / Data / The World Bank / www.worldbank.org
[16] Forest area (% of land area) /Food and Agriculture Organization, electronic files and web site. License: CC BY-4.0 / Data / The World Bank / www.worldbank.org
[17] 2016 Annual U.S. & Global Geothermal Power Production Report (PDF)/ Geothermal Energy Association / geo-energy.org
[18] What a Waste 2012 (PDF) / Resources / The World Bank / www.worldbank.org
[19] International Energy Statistic / Geography / U.S. Energy Information Administration /http://www.eia.gov/
[20] Сhina / U.S. Energy Information Administration (September 30, 2020) / www.eia.gov/beta/international/analysis.php
[21] Crude output at China's top oil field falls 7 pct in 2017 / January 11, 2018 / Reuters / af.reuters.com
[22] OPEC Annual Statistical Bulletin 2017-2020 (PDF)/ Organization of the Petroleum Exporting Countries (OPEC) / www.opec.org
[23] 中国20大炼油厂排名,中国20大地炼厂年炼油能力 / 楚天皓月0713的博客 / blog.sina.com.cn
[24] International Petroleum Encyclopaedia 2010, book / International Petroleum Encyclopaedia 2010 / www.academia.edu
[25] China / FPSO List / /http://fpso.com/
[26] Worldwide Survey of Floating Production, Storage and Offloading (FPSO) Units / August 2014 / Offshore Magazine / www.offshore-mag.com/ ; [27]【气田】2017年中国十大天然气田大评比!/ webcache.googleusercontent.com
[28] IGU 2017 World LNG Report / International Gas Union / www.igu.org
[29] Underground Gas Storage in the World – 2017 Status (July 2017) / Cedigaz / www.cedigaz.org
[30] Asia / Oil shale reserves / Wikipedia / en.wikipedia.org/wiki/Oil_shale_reserves
[31] Technically Recoverable Shale Oil and Shale Gas Resources: An Assessment of 137 Shale Formations in 41 countries outside the United States (PDF) / June 2013 Report / U.S. Energy Information Administration (June 2013) / www.eia.gov/ ;
[32] Shale gas in China / Wikipedia / en.wikipedia.org/wiki/Shale_gas_in_China
[33] Sinopec Fuling shale gas field accomplishes 2017 annual production target / January 04, 2018 / sxcoal.com / www.sxcoal.com
[34] CNPC Liaohe oilfield 2014 crude output at 10.219 mln t / January 09, 2015 / Xinhua Finance Agency / en.xinfinance.com
[35] China’s CBM Output Reported To Have Fallen In 2016 / Anna Kachkova / January 24, 2017 / NEWSBASE / newsbase.com/ ;
[36] 中国掀起“可燃冰革命”!美日虎视眈眈 / November 21, 2017 / 5e / www.china5e.com
[37] Overview of Coal and Coal-Biomass to Liquids (C&CBTL) Program, 2014 (PDF) / National Energy Technology Laboratory (NETL) / www.netl.doe.gov/ ;
[38] Underground Coal Gasification Environmental Risks and Benefits (PDF) / Jeremy Moorhouse, Marc Huot, Matt McCulloch / Pembina Institute / www.pembina.org/ ;
[39] About Jiutai / Jiutai Group / www.chinajiutai.com
[40] Coal liquefaction / Wikipedia / en.wikipedia.org/wiki/Coal_liquefaction
[41] Key China Energy Statistics 2016 / China Energy Group / china.lbl.gov
[42] Black Point Power Station / Wikipedia / en.wikipedia.org/wiki/Black_Point_Power_Station
[43] Penny's Bay Power Station / CLP / www.clp.com.hk
[44] Datang Tuoketuo power station / Source Watch / www.sourcewatch.org
[45] List of major power stations in Jiangsu province / Wikipedia / en.wikipedia.org/wiki/List_of_major_power_stations_in_Jiangsu_province
[46] Three Gorges Dam / Wikipedia / en.wikipedia.org/wiki/Three_Gorges_Dam
[47] New Chinese pumped-storage hydro plant to be “world’s largest” when complete in 2021 / May 09, 2017 / Hydroworld.com / www.hydroworld.com
[48] China’s Nuclear Fuel Cycle (Updated April 2018) / World Nuclear Association / www.world-nuclear.org
[49] Nuclear Power in China (Updated April 2018) / World Nuclear Association / www.world-nuclear.org
[50] Lithium Mining in China / Lithium Mine.com/ www.lithiummine.com
[51] SPIC Binhai North H2 / 4C Offshore / www.4coffshore.com
[52] Gansu Wind Farm / Wikipedia / en.wikipedia.org/wiki/Gansu_Wind_Farm
[53] Top 10 Cumulative capacity Dec 2017 / Global Wind Energy Council / gwec.net
[54] TOP 5 LARGEST SOLAR POWER PLANTS OF THE WORLD / Solar Insure / www.solarinsure.com
[55] Golmud 1 (57.96 MWp) / China / CPV Consortium / cpvconsortium.org
[56] Global wind report 2021 (PDF) / GWEC / gwec.net
[57] Urat Middle Banner 100MW Thermal Oil Parabolic Trough project / National Renewable Energy Laboratory: CSP Projects / www.nrel.gov
[58] SunCan Dunhuang 10 MW Phase I / National Renewable Energy Laboratory: CSP Projects / www.nrel.gov
[59] Golmud / National Renewable Energy Laboratory: CSP Projects / www.nrel.gov
[60] Jiangxia Tidal Power Station / Wikipedia / en.wikipedia.org/wiki/Jiangxia_Tidal_Power_Station
[61] Yangbajain Geothermal Power Plant / Industry About / www.industryabout.com
[62] Merchant Hydrogen Plant Capacities in Asia / HYARC / Hydrogen tools /
h2tools.org
[63]START-UP OF A MEGAWATT-SCALE FUEL CELL WITHIN FCH JU INTERNATIONAL COOPERATION WITH CHINA / Fuel Cells and Hydrogen / www.fch.europa.eu
[64] International Hydrogen Fueling Stations / Hydrogen Tools / h2tools.org
[65] Hydrogen Pipelines / Hydrogen Analysis Resource Center / hydrogen.pnl.gov
[66] Hydrogenics receives $7.8m fuel cell order in China / January 18, 2018 / gasworld / www.gasworld.com
[67] 2020 / Installed capacity / China / Technologies / International Renewable Energy Agency (IRENA) / resourceirena.irena.org
[68] Biofuels – At What Cost? Government support for ethanol and biodiesel in China, November 2008 / Global Subsidies Initiative (GSI) of the International Institute for Sustainable Development (IISD) / www.iisd.org/ ;
[69] China's largest biomass fuel project begins operation in Zhanjiang / December 06, 2017 / China Daily /
www.chinadaily.com.cn
[70] Josef Modi: Jilin fuel ethanol plant / Vogelbusch Company / www.vogelbusch-biocommodities.com
[71] Longlive Bio-technology Co. Ltd. / IEA Bioenergy Task 39 / demoplants.bioenergy2020.eu
[72] This pile of manure is gold / September 29, 2009 / China.org / www.china.org.cn
[73] Projects / Demoplants 21 /http://demoplants21.bioenergy2020.eu/
[74] Commercial Operating Facilities / Projects / Westinghouse Electric Corporation / www.westinghouse-plasma.com
[75] Large Industrial Users of Energy Biomass, September 2013 / IEA Bioenergy Task 40 / bioenergytrade.org
[76] Waste-to-Energy in China (February 2017) (PDF)/ United Nations Office for Sustainable Development / www.unosd.org
[77] Project 6348 : Laogang Landfill Gas Recovery and Utilization Project / Clean Development Mechanism (CDM) / cdm.unfccc.int
[78] China To Invest $360bn In Renewable Energy By 2020 / January 6, 2017 / The Climate Group / www.theclimategroup.org
[79] China’s energy market in 2020 (PDF) / BP / www.bp.com
[80].统计局:2017年太阳能发电量967亿千瓦时增长57.1% / Bureau of Statistics: Solar power generation in 2016 was 97.7 billion kWh, an increase of 57.1% 中国能源网 / 20 Mar 2018 / China Energy Network / www.china5e.com
[81] China's Energy Policy And Related Issues Towards 2020 / Takuma Yatsui / Monthly Report April 2017 / Mitsui Global Strategic Studies Institute / www.mitsui.com
[82] National Bureau of Statistics of China / www.stats.gov.cn/english/
The sources of charts and curves are specified under the images.
For more information about the energy industry in China see here
