
Contents
General State of the Economy
The Netherlands is located in the north-west of mainland Europe. The Kingdom of the Netherlands, along with the main territory, also includes the Caribbean Netherlands and the islands of Aruba, Curacao and Sint Maarten. The mainland is bordered by Belgium to the west and Germany to the east The north of the country borders the North Sea. The Netherlands is the 134th largest country in the world in terms of area, is home to more than 17 million people, as of 2021. In terms of population density the country is 16th in the world [1,2,3]. The length of the coastline is 451 km [3].
The Netherlands is a unitary parliamentary constitutional monarchy and its administrative map is divided into 12 provinces. The official language is Dutch [3]. The Netherlands is among the ten strongest economies in the world, which is reflected in the diagram – Figure 1.
For almost all indices the Netherlands ranks higher than the world average, in the top 25% of the leading countries in the world included in the rating.
| Sources: 1. GDP (purchasing power parity), 2020 est. / The World Factbook/Library/Central Intelligence Agency *228 2. GDP - per capita (PPP), 2020 / The World Factbook/Library/Central Intelligence Agency *229 3. Inflation rate (consumer prices), 2019 est. / The World Factbook/Library/Central Intelligence Agency *228 4. Charges for the use of intellectual property, receipts (BoP, current US$), 2020 / International Monetary Fund, Balance of Payments Statistics Yearbook, and data files. / License: CC BY-4.0 *88 5. The Global Competitiveness Index 2019 / Rankings / Reports / World Economic Forum *141 6. High-technology exports (current US$) 2019-2020 / United Nations, Comtrade database through the WITS platform / License: CCBY-4.0 / Data *134 7. 2021 Index of Economic Freedom / International Economies / The Heritage Foundation *178 8. Reserves of foreign exchange and gold, 2017 est. / The World Factbook / Library / Central Intelligence Agency *195 9. Annual average GDP growth in %, for the last 10 years (2011-2020) / World Bank national accounts data, and OECD National Accounts data files / License: CC BY-4.0 *206 10. Public debt (% of GDP), 2017 est. / The World Factbook / Library / Central Intelligence Agency (from smallest to largest) *210 * Total number of countries participating in ranking Figure 1. Economic Indices of the Netherlands |
Since the early 1990s the country has experienced sustained GDP growth at purchasing power parity, both in general and per capita [4,5]. GDP at purchasing power parity increased from $966.02 billion in 2017 to $945.48 billion (26th in the world) in 2020 [3]. GDP at purchasing power parity per capita is somewhat higher (22nd in 2020); the dynamics of this indicator is is changeable: from $56 100 in 2018 to $54 200 in 2020 [3]. Inflation rate rose from 1.3% in 2018 to 2.6% in 2020 (132nd in the world) [3].
According to The Global Competitiveness Report 2019, presented by the World Economic Forum, the Netherlands placed 4th from a total of 141 countries considered, behind Switzerland, Singapore and the USA; in the last year it gained one rating position. This rating measures the effectiveness of the use of the country’s own resources for sustainable development. In addition to a number of economic indicators this index also takes into account such variables as education, health, level of innovation, etc.
In terms of high-technology exports between 2019-2020, the Netherlands was 11st from a total of 134 countries, behind, for example, France, but ahead of the UK. According to the Index of Economic Freedom which takes into account business freedom, freedom from government intervention, protection of property, and freedom from corruption, the Netherlands was 16th out of 178 countries in 2021, and 13rd in 2019. In terms of reserves of foreign exchange and gold, the country was 46th in 2017 – with $38.44 billion.
Fourteen Dutch companies, including the energy giant Royal Dutch Shell, are among the “Fortune 500” largest companies in the world.
In addition to Royal Dutch Shell, Koninklijke Vopak N.V. (a global service provider for the storage and transportation of liquid and gaseous fuels) is also included in the Global Energy Companies rating. According to the indicator for the average GDP growth in percentage over the last 10 years, the country ranked 158th out of 206 countries in 2020. In terms of public debt, calculated as a percentage of the country's GDP, the Netherlands was placed 78th out of 210 countries considered in 2017.
Energy Resources
The Netherlands does not have significant reserves of oil and coal, but in terms of gas reserves the country is 26th in the world, and 2nd in the EU (Table 1) [3]. For comparison, proven gas reserves in the Netherlands are half that of Norway, one-fifth that of Algeria and less than one-tenth that of the USA.
Table 1. Fossil energy resources of the Netherlands
| Resource/ Explanations | Crude oil | Natural gas | Coal | Shale Gas* | Tight Oil* |
|---|---|---|---|---|---|
| Value | 81.13 | 801.4 | 548 | 25.9 | 2.9 |
| Unit | million bbl | Bcm | million short tonnes | Tcf | billion bbl |
| Year | 2018 | 2018 | 2019 | 2013 | 2013 |
| Source | [3] | [3] | [9] | [10] | [10] |
*unproved technically recoverable
According to the Energy Information Administration [6], proven oil reserves in the Netherlands in 2021 amounted to 0.1 billion barrels, and according to [3] were estimated at 81.13 million barrels as of the beginning of 2018 (72nd place in the world).
At the end of 2021 proven natural gas reserves in the Netherlands were 4.7 Tcf [6]. In [3] they were estimated at 801.4 Bcm in 2018 and at 4.6 Tcf, according to [7]. According to the Energy Authority of the Netherlands (Energie Beheer Nederland B.V. EBN), in 2016 the residual oil resources in the country were 199 million barrels, and gas resources were 891 billion m3 [8]. The recoverable coal resources as of 2021 were estimated at 548 million short tons [9].
The Netherlands also has the third largest shale gas reserves in Western Europe – 25.9 Tcf and the second largest tight oil reserves in Western Europe – 2.9 billion barrels [10].
The Netherlands has a variety of renewable resources for energy production. A selection of basic indicators of this type of resource is presented in Table 2.
Table 2.Renewable energy resources of the Netherlands
| Resource/ Explanations | Solar Potential (GHI)* | Wind Potential (50 м)* | Bio Potential (agricultural area) | Bio Potential (forest area) | Municipal Solid Waste |
|---|---|---|---|---|---|
| Value | 2.7-3.0 | <6.0 | 53.3 | 11.2 | 511 |
| Unit | kWh/m2/day | m/s | % of land area | % of land area | kg per capita |
| Year | 2018 | 2018 | 2016 | 2016 | 2018 |
| Source | [11] | [12] | [14] | [15] | [16] |
*for most of the territory of the country
The level of global horizontal irradiation for the majority of the country is low – between 2.7-3.0 kWh/m2/day [11]. Wind resources in the Netherlands have much higher indicators, the use of which has deep historical roots int he country. The distribution of wind resources are as follows: for the majority of the country the wind speed is <6.0 m/s, and along the North Sea coastline it can reach 7.0 m/s at a height of 50 m [12]. Due to its flat topography and minor elevation difference, hydropower potential in the country is very low [13]. According to 2018 data, around 54.1% of the country was covered by agricultural land, and 11.0% was forested [14,15].
In 2018 the level of municipal waste generation in the Netherlands was 511 kg per capita; comparable with, for example, France – (527 kg per capita), but far ahead of neighbouring Belgium – (411 kg per capita) [16].
Energy Balance
According to the BP Statistical Review of World Energy 2021, primary energy consumption in the Netherlands in 2020 amounted to 3.37 Exajoules and was dominated by oil –44.8%, followed by gas – 39.2%, coal –5.3%, nuclear energy –1.2%, and renewable energy –9.8% [7]. In 2018, according to Energie Beheer Nederland B.V. the volume of primary energy consumption was 3147 PJ, of which around 39% was from natural gas, 39% from oil, 14% from coal, 6% from renewable energy, 1% from nuclear power and 1% from other energy sources [17].
Using data from [3,7] we calculated the value of the Netherlands GDP per unit of energy use in 2017 at 10.6 US dollars, taking into account the PPP in 2011 (the equivalent of energy contained in one kg of oil).
Oil production between 2011 and 2020 remained relatively stable, not exceeding 95 000 barrels/day [18].
Source: U.S. Energy Information Administration (Dec 2021) / www.eia.gov
Figure 2. The production and consumption of fossil fuels in the Netherlands (coal – left, gas – in the center, oil – right)
The volume of oil consumption in the country has show a decline since 2007 (Fig.2) and in 2017 - 2020 totalled 858 000 barrels [19]. BP reported the level of consumption to be 771 000 barrels/day in 2020 [7]. Oil consumption in 2016 according to the statistical bureau of the Netherlands, was 1 171,4 PJ [19].
Oil imports to the Netherlands in 2020 amounted to 994 million barrels/day; the main suppliers of oil are Russia, Norway, the United Kingdom and Kuwait [6]. The consumption of natural gas in the Netherlands between 2015 and 2020 remained relatively stable, not exceeding 1 694 Bcf (with small fluctuations), but have significantly decreased since 2010 to 2014 (Fig.2) reaching the level of 1,580 Bcf in 2020 [18]. The BP Statistical Review of World Energy June 2021 [7] estimated consumption in 2020 at 36.6 billion m3. Natural gas production declined significantly and in 2019 amounted to 1160 billion cubic meters feet [18], and according to [7] in 2020, it reached 20 billion m3. Gas consumption in 2016, according to the Centraal Bureau voor de Statistiek [19], was 1 285 PJ, and production, according to Energie Beheer Nederland B.V. [8] totalled 49.7 Bcm in 2015.
The main importers of natural gas from the Netherlands are European countries. Gas is supplied to the UK, Germany and Belgium via the largest European natural gas pipeline - the Title Transfer Facility [6].
Gas exports in 2019 amounted to 1 512 Bcf, with imports at 1 969 Bcf [18]. The Netherlands is the eighth largest exporter of natural gas in the world [3].
Coal consumption in the country gradually grew between 2009 and 2014 and in 2017 totalled 16.2 million short tons [18]; in 2020 - according to the data from BP's report – this totalled 0.18 EJ [7].
Historically, the Netherlands has a high share of fossil fuels in electricity production (Fig.3).
In 2020, according to the U.S. Energy Information Administration, the Netherlands generated 119 TWh electricity, of which about 68% was from fossil fuels, 3.2% from nuclear power, 0.1% from hydropower, and 29% from renewable energy (Fig. 6). According to Compendium voor de Leefomgeving in 2017, electricity production totalled 945 PJ, which is 2% lower than in 2016 [20].
Sources: U.S. Energy Information Administration (Dec 2021) / www.eia.gov | ||
| Figure 3. Electricity generation in the Netherlands |
The Netherlands’ position in the comparative diagram of energy index is shown in Figure 4. As previously mentioned, the Netherlands does not have significant reserves of fossil resources, therefore some indices related to oil and coal are extremely low.
| Sources: 1. Crude oil proved reserves, 2021 / International Energy Statistic/Geography / U.S. Energy Information Administration (Nov 2021)*98 2. Natural gas proved reserves 2021 / International Energy Statistic / Geography / U.S. Energy Information Administration (Nov 2021) *99 3. Total recoverable coal reserves 2019 / International Energy Statistic / Geography / U.S. Energy Information Administration (Nov 2021) *81 4. Combination production-consumption for Crude oil 2018 / International Energy Statistic / Geography / U.S. Energy Information Administration (Nov 2021) *219 5. Combination production-consumption for Natural gas 2019 / International Energy Statistic / Geography / U.S. Energy Information Administration (Nov 2021) *123 6. Combination production-consumption for Coal 2019 / International Energy Statistic / Geography / U.S. Energy Information Administration (Nov 2021) *128 7. Electricity – from other renewable sources (% of total installed capacity), 2017 est. / The World Factbook / Library / Central Intelligence Agency *170 8. GDP per unit of energy use (PPP per unit of oil equivalent), 2020 *66 Primary energy consumption - BP Statistical Review of World Energy 2021/BP;GDP (purchasing power parity) - The World Factbook/Library/Central Intelligence Agency 9. Energy use (primary energy use of oil equivalent per capita) 2020 *127 Primary energy consumption – BP Statistical Review of World Energy 2021; Population - United Nations, Department of Economic and Social Affairs, Population Division (2019). World Population Prospects 2019, custom data acquired via website. Retrieved 15 November 2021*66 10. The Global Energy Architecture Performance Index Report (EAPI) 2017 / Rankings / Reports / World Economic Forum 11. Electric power consumption (kWh per capita), 2016 *217 Electricity Consumption - The World Factbook / Library / Central Intelligence Agency; Population - United Nations, Department of Economic and Social Affairs, Population Division (2019). World Population Prospects 2019, custom data acquired via website. Retrieved 15 November 2021 12. Combination of electricity production-consumption (kWh)/The World Factbook/Library/Central Intelligence Agency *216 * Total number of countries participating in ranking Figure 4. Energy indices of the Netherlands |
The volume of fossil resources is many times lower than the level of consumption in the Netherlands, which contributes to the development of energy-saving technologies and renewable energy. In terms of the share of electricity production from renewable energy sources (excluding hydropower) the Netherlands was 31st out of 170 countries selected for consideration in 2017, ahead of France and Switzerland .
The Netherlands is ranked 33rd in the EAPI of 2017 (Energy Architecture Performance Index), which is based primarily on the level economic growth, environmental safety, and energy independence of the country, including access to energy. Over the last 8 years the country has lost 13 positions in the rating and placed behind a number of EU countries.
In terms of GDP per unit of energy use in 2020, the Netherlands was below the world average – 28th out of 66 countries selected for consideration; however, in terms of energy use per capita it is much higher – 17th out of 66 countries selected for consideration.
In terms of electricity consumption per capita, the country is 42th in the world, however, for combined electricity production-consumption, the Netherlands is 108th in the ranked list of 216 countries.
Energy Infrastructure
A territorial map showing the distribution of the largest infrastructure projects of the fossil-fuel sector in the Netherlands is shown in Figure 5. In the total potential of natural resources, natural gas accounted for 24.6%, coal for 71.5%, and oil for 3.9%. The matrix of the total potential of unconventional resources is as follows: 63.4% shale gas; and 36.6% tight oil (Fig. 5).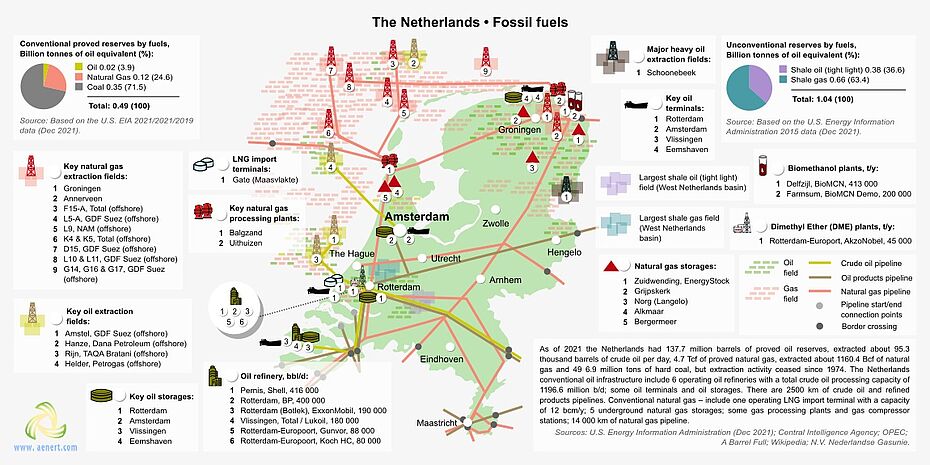
Figure 5. Basic Infrastructure facilities of the fossil fuel sector and electricity in the Netherlands
The main natural gas fields are concentrated on the shelf of the North Sea, in the Groningen area, and in the north of the country. Annual production from the Groningen Natural Gas Field was 24 Bcm in 2016, but in 2017 production is expected to decline by 10% [21]. The largest natural gas storage facility is Zuidwending, with a total volume of underground salt caves of 620 million m3 [22,23].
Gas exports are carried out via Gate (Maasvlakte) LNG terminal, owned by Gasunie and Vopak with a capacity of 12 Bcm per year [24], and internally gas is transported via a pipeline network with a total length of 14 000 km (Fig.5).
The infrastructure of natural gas processing is represented by two large plants: Balgzand in the area of the capital; and Uthulzen in the north of the country.
The main oil fields are predominantly offshore and are located in the west and northwest of the costal shelf. The largest is Amstel, owned by GDF Suez; production from this field in 2014 was 15 000 barrels/day [25].
The Dutch refineries have a total installed capacity of 1 196.6 million barrels/day (Fig. 5). The country's largest oil refinery is Pernis, owned by Shell, with an installed capacity of 416 000 barrels per day [26].
The main oil terminal and oil storage of the Netherlands is in Rotterdam, with a storage capacity of about 8 307 200 m3 [27]. Oil fields, refineries and main consumers in the country are connected by pipelines for the transportation of oil products and crude oil with a total length of 2 500 km (Fig. 5).
The shale gas reserves in the country are 63.4%, and the reserves of tight oil are 36.6% of the total potential of unconventional resources. The main fields are located in the region of The Hague and Rotterdam.
The Netherlands is an advanced country in the field of oil and gas chemistry, and the production of various products from fossil fuels and bioresources. Thus, the Netherlands is home to enterprises for the production of dimethyl ether (DME) – Rotterdam-Europort, AkzoNobel DME Plant, capable of producing about 45 000 mt per year,; and two biomethanol plants, the largest of which is Farmsum, BioMCN Demo Biomethanol Plant which has an installed capacity of 200 000 tons/year [28,29].
A map showing the territorial distribution of the largest infrastructure facilities in the Netherlands for electricity generation is presented in Figure 6.
According to the U.S. Energy Information Administration, the share of fossil fuels in electricity production in the Netherlands in 2020 was 67,6% (Fig.6.).
The country has a significant number of stations for the production of electricity from fossil fuels, including 12 gas-fired power plants with a capacity of more than 500 MW, five coal-fired power plants with a capacity of more than 100 megawatts, and a large number of less powerful stations (Fig.6). The largest thermal power plants in the Netherlands are: gas power plant – Eems, with a total capacity of 2 400 MW [30], coal power plant – Eemshaven, with an installed capacity of 1 560 MW [31].
As already noted above, hydropower in the country does not have a significant share in the production of electricity, it is represented by three large power plants and a large number of small hydroelectric power plants, which in 2016 produced 2.81 TWh (Fig. 6). The largest hydroelectric power plant is Alphen aan de Maas with an installed capacity of 14 MW [32]. Nuclear power is represented by the Borssele station with an installed capacity of 485 MW [33].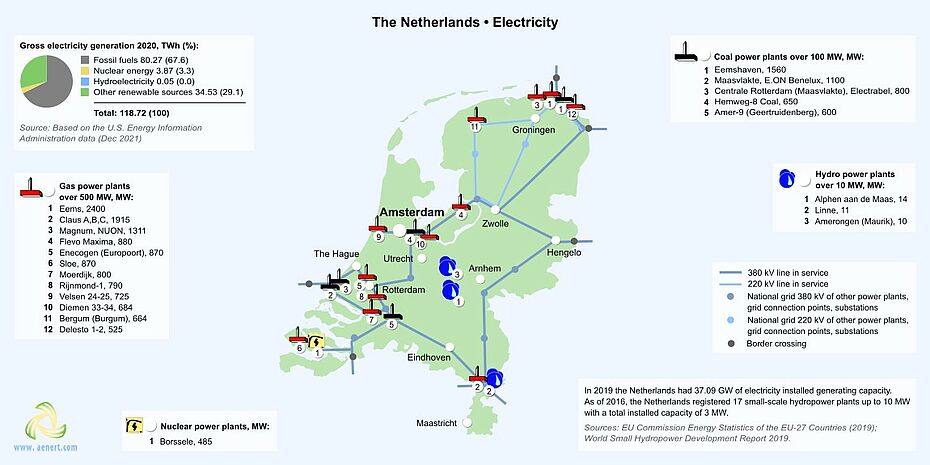 Figure 6. Electricity production in the Netherlands
In Figure 7, you can see the main facilities for the production of energy from renewable sources.
As noted above, renewable energy in the Netherlands, excluding hydropower, does not have a significant influence on electricity generation. The total production of electricity from renewable sources in 2019 excluding hydropower, was 22.67 TWh (Fig. 7).
On the coast of the North Sea, in the north and north-west of the country, in zones of high wind activity, 13 large wind farms with a capacity of more than 60 megawatts each were installed. In 2017 the wind farms in the Netherlands had a total installed capacity of 4 341 MW [34]. The largest of these is the offshore Gemini farm, with an installed capacity of 600 MW [35].
As mentioned previously, the level of direct horizontal solar irradiation in some regions of the country can reach 3.5 kWh/m², which is a low, but sufficient resource for the production of energy through photovoltaics [11]. As a result, there are a number of solar energy facilities installed on this territory, including 7 photovoltaic stations with a capacity of more than 1 MW each (Fig. 7). The Solar Panel Roof Floriade, with an installed capacity of 2.3 MW, covers an area of three football fields and has more than 19 000 solar panels on the roofs of buildings; it is the largest PV station of this type in the world [36].
The Netherlands actively uses hydrogen as an energy source for vehicles, and in various other industries. In 2020, 5 hydrogen filling stations were in operation in the country. 6 Compressed Hydrogen Plants are operated by Air Liquid (Figure 7), the largest of which was Bergen op Zoom (32,042 Nm3/hr) [37]. The Cryogenic Liquid Hydrogen Plant in Rozenburg, owned by Air Products, has an installed capacity of 2,502 Nm3/hr [38]. Hydrogen is transported through several pipelines with a total length of 137 km (Fig. 7).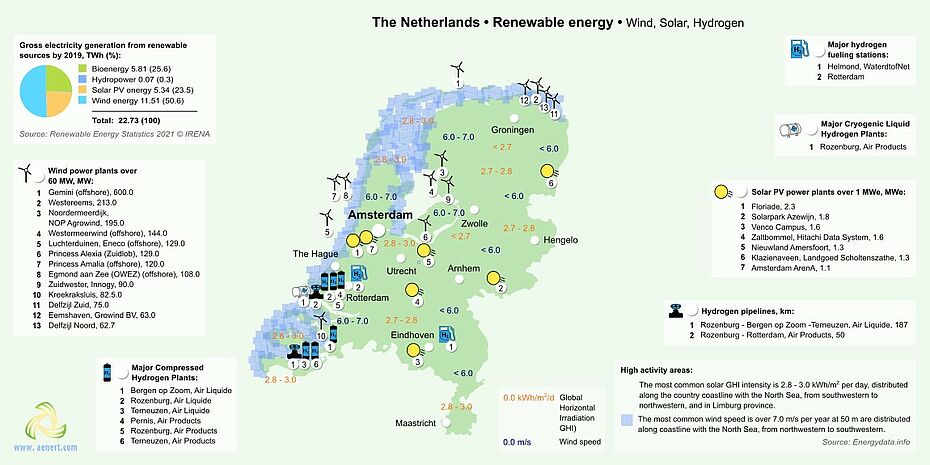
Figure 7. Renewable energy in the Netherlands: wind, solar and hydrogen
Figure 8 shows the main bioenergy facilities in the Netherlands for energy production.
2019 biomass generated about 5,81 TWh (Fig. 7). Nationwide, there are enterprises for processing biomass and municipal waste, producing biogas, biodiesel, bioethanol, pellets and landfill gas. Eneco manages the largest biomass processing plant – Golden Raand, with an installed capacity of more than 50 MWel [39]. The Ecopark De Wierdegas-to-energy plant can generate about 19 056.0 MWh of electricity from landfill gas [40].
Abengoa Bioenergia produces about 127 Mgal of bioethanol annually at the country's largest enterprise - Europoort [41]. Sas van Gent, a second generation bioethanol plant, produces 2.0 Ml of bioethanol annually [42].
The main companies in the field of bioenergy are: in Rotterdam, Neste Oil Biodiesel Plant, with an installed capacity of 800 000 tons of biodiesel per year; Geertruidenberg (Amer-9), Essent Biomass Gasification Plant with an installed capacity of 85 MWth; and Waardenburg, Plospan Bioenergy B.V. Wood pellet plant, which can produce 125 000 tons of pellets annually [43]. The leader in the generation of electricity from municipal waste is Amsterdam Centrale, which has an installed capacity of 74 MW [44]. Steenwijk torrefication plant, has an installed capacity of 90 000 tons per year [43]. The Hengelo Empyro Project, a fast pyrolysis plant capable of processing 120 tons of biomass per day, equivalent to 25 MWt; there are plans to increase production to 20 million litres of fuel per year, which theoretically could provide about 8 000 households with energy and reduce CO2 emissions by 20 000 tons [45].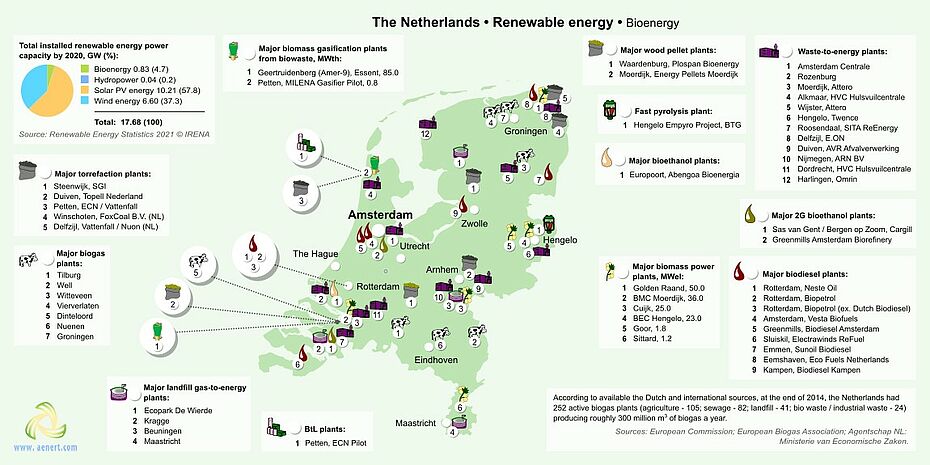
Figure 8. Renewable energy in the Netherlands: bioresources
The PettenBtL-FT (Thermochemical BTL Plants) pilot project, launched by the Energy Research Center of the Netherlands (ECN) in 2008, has an installed capacity of 0.8 MWth [46].
One of the main priorities of the national energy policy is to increase the share of renewable energy sources to 14% by 2020 and to 16% by 2023. To this end, the government is taking a number of measures, including actively subsidizing renewable energy, and reducing taxes on electricity produced by small solar units. The government also plans to require the use of biofuel for refuelling cars.
The Netherland’s energy policy is also focussed on energy saving; up to 100 PJ by 2020. It is planned to introduce strict energy efficiency standards for new homes and office buildings in the country, and from 2021 all new buildings must meet these requirements [47]. Thus, all houses receive an indicator energy label from letter A to G, where A means maximum energy efficiency, and G the least economical [48]. A special fund was also created that allows owners of existing houses to receive a loan for energy-saving equipment with a low interest rate. For this purpose, the government allocated 75 million euros; 300 million euros were provided by private investors [48].
The state-owned Gasunie Transport Services B.V. (GTS) plans to modernize the existing nitrogen plant in the Tussenklappenpolder in Zuidbroek (municipality of Menterwolde) by 2019 [49].
At least 9 wind farms are in the modernization or construction phase. In the offshore zone, 22.2 km away from the coast, two wind farms with a capacity of 350 MW each are currently being built [50].
Three high-voltage transmission lines: Doetinchem-Wesel 380 kV; Randstad 380 kV-Noordrin; and Zuid-West 380 kV west (Borssele-Rilland), are at the stage of design and construction, under the management of TenneT [51,52,53].
At the initiative of Uniper and Engie (Maasvlakte CCS Project CV), a demonstration project on the collection, storage and transportation of СО2–ROAD-project (Rotterdam Opslag in Afvang Demonstratieproject) will be implemented in Rotterdam.
The CO2 collected at the Unipower Power plant Maasvlakte Power Plant 3 (MPP3) will be compressed to 80 bar and will be directed to a storage facility in the North Sea through an underground pipeline [54].
In the field of hydrogen, ”Battolyser" technology, should be noted. It is being developed by the Technical University of Delft, and combines the storage of electricity with hydrogen production, allowing for the efficient and profitable storage of electricity [55].
Education and Innovation
A set of indices reflecting the positioning of the Netherlands in comparison with the rest of the world in the field of education and innovation is presented in Figure 9. From the diagrams presented it can be seen that the Netherlands is a country with a very high level of education and innovation.
According to the Global Innovation Index 2021, the Netherlands is ranked 6th after Switzerland, Sweden, UK out of 132 countries (see diagram for links). According to the second and third index, the Netherlands ranks highly in the level of patent activity, including patenting in the field of energy.
A significant level of government expenditure on education, as a percentage of the country's GDP (46th in the world) contributes to 13 universities entering the QS University Rating. The country's GDP is high, therefore, in absolute terms, the costs of education and research are significant.
| Sources: 1. The Global Innovation Index 2021, Rankings / Knowledge / World Intellectual Property Organization / Cornell University, INSEAD, and WIPO (2021): Energizing the World with Innovation. Ithaca, Fontainebleau, and Geneva *132 2. Patent Grants 2011-2020, resident & abroad / Statistical country profiles / World Intellectual Property Organization *185 3.Patents in Force 2020 / Statistical country profiles / World Intellectual Property Organization *109 4. QS World University Rankings 2022 *97 5. SCImago Country Rankings (1996-2020) / Country rankings / SCImago, (n.d.). SIR-SCImago Journal & Country Rank [Portal]. Retrieved 17 Nov 2021 *240 6. Internet users in 2018 / The World Factbook / Central Intelligence Agency *229 7. Internet users in 2018 (% Population) / The World Factbook / Central Intelligence Agency *229 8. Government expenditure on education, total (% of GDP), 2019 / United Nations Educational, Scientific, and Cultural Organization (UNESCO) Institute for Statistics. License: CCBY-4.0 / Data as of September 2021*177 9. Research and development expenditure (% of GDP), 2018 / UNESCO Institute for Statistics. License: CCBY-4.0 / Data *119 10. Scientific and technical journal articles, 2018 / National Science Foundation, Science and Engineering Indicators. License: CCBY-4.0 / Data *197 * Total number of countries participating in ranking Figure 9. The indices of education and innovation in the Netherlands |
In terms of public expenditure on research and development, as a percentage of GDP, the country is 18th, behind a number of European countries, including Switzerland and Germany. The Netherlands is well positioned when considering the number of publications of specialists in scientific and technological journal and patent activities. The country is 15th out of 240 participating countries in the Scimago ranking, and in Scientific and Journal Activities it is ranked 18th out of 197 countries.
The universities of the Netherlands, such as Eindhoven University of Technology, Delft University of Technology, and the University of Twente train specialists in various fields of energy, including Electrical Engineering, Sustainable Energy Technology, Chemical Engineering, etc.
In the field of synthetic fuel production, extraction and processing of unconventional oil, the leaders in patenting are Shell Internationale Research Maatschappij B.V., Stichting Energieonderzoek Centrum Nederland, BASF Nederland B.V., Albemarle Netherlands BV, Stamicarbon BV.Research, and research and development in this field is carried out by Eindhoven University of Technology, Delft University of Technology, University of Twente, and the University of Utrecht.
In the field of extraction and processing of unconventional oil, patents for inventions are owned by Shell Internationale Research Maatschappij B.V., Schlumberger Technology B.V. The European Association of Geoscientists and Engineers (EAGE) is also actively engaged in research in this field.
Shell Internationale Research Maatschappij B.V., Schlumberger Technology B.V. are the leading patent holders in the field of coal bed methane, gas hydrates, associated gas, hydrocarbon production from low-permeability reservoirs. Studies in these areas are also carried out by Delft University of Technology, University of Utrecht, and the Royal Netherlands Insight for Sea Research (NIOZ).
The leading patent holders in the field of bioenergy are Shell Internationale Research Maatschappij B.V., Stichting Energieonderzoek Centrum Nederland, Shell Oil Company, Bioecon International Holding N.V., Nederlandse Organisatie voor toegepastnatuurwetenschappelijk onderzoek TNO, DSM IP Assets B.V.
Delft University of Technology, University of Groningen, University of Utrecht, Wageningen University, and the University of Twente are conducting research in this field.
A large number of Dutch companies patent technical solutions in the field of energy production from renewable sources. Notable in the field of solar energy are Koninklijke Philips N.V., Antecy B.V., Econcern B.V., and Graphite Energy N.V. Leading research universities in this field are Delft University of Technology, Eindhoven University of Technology, and the University of Utrecht. In the field of wind energy Xemc Darwind B.V., Windfin B.V., and WILIC SARL are prominent. Research and development in this field is carried out by Delft University of Technology, Knowledge Centre WMC, and the Maritime Research Institute.
Ecology and Environment Protection
The environmental index diagram presented in Figure 10 reflects to some extent the ecological situation in the country.
The country demonstrates a relatively high level of CO2 emissions both in general, and per capita. In 2014, CO2 emissions from coal mining and processing amounted to 20 mt, which is much less than in, for example, Poland, – 129 mt and neighbouring Germany – 256 mt, but more than in France – 11 mt [52]. On average, the cost of eliminating the consequences of such emissions for the Netherlands is more than 2,7 billion euros (health costs, pollution costs); in Germany this figure is more than 4 billion euros [52]. It is also necessary to note a high level of methane emissions.
| Sources: 1. CO2 total emission by countries 2020 / European Commission / Joint Research Centre (JRC) / Emission Database for Global Atmospheric Research (EDGAR)*208 2. CO2 per capita emission 2020/European Commission/Joint Research Centre (JRC) / Emission Database for Global Atmospheric Research (EDGAR) *208 3. Forest area 2020 (% of land area) / The Global Forest Resources Assessment 2020 / Food and Agriculture Organization of the United Nations *234 4. Forest area change 2010-2020 (1000 ha/year) / The Global Forest Resources Assessment 2020 / Food and Agriculture Organization of the United Nations *234 5. The Environmental Performance Index (EPI) 2020 / Rankings / Yale Center for Environmental Law & Policy / Yale University *180 6. Annual freshwater withdrawals (m3 per capita), 2017 *179 Annual freshwater withdrawals, total (billion m3), 2017 – Food and Agriculture Organization, AQUASTAT data. /License: CC BY-4.0; Population – United Nations, Department of Economic and Social Affairs, Population Division (2019). World Population Prospects 2019, custom data acquired via website. Retrieved 15 November 2021 7. The National Footprint Accounts 2017 (Biocapacity Credit / Deficit) / Global Footprint Network *188 8. Methane emissions (kt of CO2 equivalent), 2018 / Data for up to 1990 are sourced from Carbon Dioxide Information Analysis Center, Environmental Sciences Division, Oak Ridge National Laboratory, Tennessee, United States. Data from 1990 are CAIT data: Climate Watch. 2020. GHG Emissions. Washington, DC: World Resources Institute. Available at: License : Attribution-NonCommercial 4.0 International (CC BY-NC 4.0) *191 9. The Climate Change Performance Index (CCPI) 2022 / Overall Results / Jan Burck, Thea Uhlich, Christoph Bals, Niklas Höhne, Leonardo Nascimento / Germanwatch, NewClimate Institute & Climate Action Network *60 * Total number of countries participating in ranking Figure 10. Environmental Indices of the Netherlands |
Netherlands is regarded as one of the 61 countries responsible for more than 90% of global CO2 emissions related to energy in the Climate Change Performance Index (CCPI). Over the past year, the country has lost 18 positions in the rating.
In terms of forest area as a percentage of the country, the Netherlands is 173th in the world, but demonstrates a positive trend. Clearly, the preservation of forests is a priority for the state.
The situation is brightened by a relatively high valuation of the Netherlands in the Environmental Performance Index rankings (EPI), which focuses primarily on assessing the environmental performance of national governments. Here, the country is 11nd out of 180 countries, behind Sweden, the UK and France.
According to the Ecological Footprint Atlas rating, the Netherlands is among a number of ecological debtors.
References
[1] List of sovereign states and dependencies by area / Wikipedia / en.wikipedia.org/wiki/List_of_sovereign_states_and_dependencies_by_area
[2] List of countries and dependencies by population density / Wikipedia / en.wikipedia.org/wiki/List_of_countries_and_dependencies_by_population_density
[3] The Netherlands / The world factbook / Library / Central Intelligence Agency / www.cia.gov
[4] GDP, PPP (constant 2011 international $) / World Bank, International Comparison Program database. License : CC BY-4.0 / Data / The World Bank / www.worldbank.org
[5] GDP per capita, PPP (current international $)/ World Bank, International Comparison Program database .License : CC BY-4.0 / Data / The World Bank / www.worldbank.org
[6] The Netherlands / Geography / U.S. Energy Information Administration (Nov 2021) /http://www.eia.gov/beta/international/
[7] BP Statistical Review of World Energy June 2021 (PDF) / BP / www.bp.com
[8] Nederland, land van... / Infographic Energievebruik en Energiewinning Nederland 2017 / www.ebn.nl
[9] Coal Recoverable Reserves 2017 / U.S. Energy Information Administration (Jan 2020) / www.eia.gov/beta/international/
[10] World Shale Resource Assessments / U.S. Energy Information Administration (September 24, 2015) / www.eia.gov
[11] Solar resource data obtained from the Global Solar Atlas, owned by the World Bank Group and provided by Solargis / Global Solar Atlas / globalsolaratlas.info
[12] Wind Map / Global Wind Atlas 2.0, a free, web-based application developed, owned and operated by the Technical University of Denmark (DTU) in partnership with the World Bank Group, utilizing data provided by Vortex, with funding provided by the Energy Sector Management Assistance Program (ESMAP). For additional information: globalwindatlas.info
[13] Hydroelectricity in the Netherlands / Wikipedia / en.wikipedia.org/wiki/Hydroelectricity_in_the_Netherlands
[14] Agricultural land (% of land area) / Food and Agriculture Organization, electronic files and web site. License: CC BY-4.0 / Data / The World Bank / www.worldbank.org
[15] Forest area (% of land area) /Food and Agriculture Organization, electronic files and web site. License: CC BY-4.0 / Data / The World Bank / www.worldbank.org
[16] Municipal waste statistics Updated / Full list / Statistics Explained / Eurostat / ec.europa.eu
[17] Nederland, land van... / Infographic Energievebruik en Energiewinning Nederland 2018 / www.ebn.nl
[18] International Energy Statistic / Geography / U.S. Energy Information Administration (Nov 2021) /http://www.eia.gov/beta/international/
[19] Energieverbruik gedaald in 2018 /Centraal Bureau voor de Statistiek / www.cbs.nl
[20] Bruto elektriciteitsproductie en inzet energiedragers, 1998-2017 / Compendium voor de Leefomgeving / www.clo.nl
[21] Dutch government plans 10% cut to Groningen gas production/ 18 April 2017 / ICIS / www.icis.com
[22] Onze cavernes / Aardgasbuffer Zuidwending / www.agbzw.nl
[23] Completion of expanded gas storage facility at Gasunie Zuidwending B.V. / 1 October 2013 / About Energy Stock / EnergyStock / www.energystock.com
[24] Gate terminal / Gate terminal / www.gate.nl
[25] Amstel / the Netherlands/ Europe – North Sea / SubSeaIQ / www.subseaiq.com
[26] The Netherlands / List of oil refineries / Wikipedia / en.wikipedia.org
[27] Terminals / The Netherlands / Vopak / www.vopak.com
[28] Dimethyl Ether / Products / AkzoNobel N.V. / www.akzonobel.com
[29] Successful start up new plant / January 1, 2010 / BioMCN / www.biomcn.eu
[30] Eemscentrale / Wikipedia / nl.wikipedia.org
[31] Eemshaven Power Plant / Netherlands / RWE Generation SE / www.rwe.com
[32] Waterkracht / Energieproductie / Nuon / www.nuon.com
[33] Nuclear Power in the Netherlands / World Nuclear Association / www.world-nuclear.org
[34] Wind power in the Netherlands / Wikipedia / en.wikipedia.org/wiki/Wind_power_in_the_Netherlands
[35] The 600-MW Gemini offshore wind farm is successfully up & running / May 1, 2017 / Windpower Engineering & Development / www.windpowerengineering.com
[36] Solar Panel Roof Floriade (NL) / Projects / EdenParks / www.edenparks.eu/en/
[37] Merchant Hydrogen Production Capacities in Europe / Hydrogen Tools / h2tools.org
[38] James Evans West. The Economics of Small to Medium Liquid Hydrogen Facilities. (May 2003) (PDF) / Google / www.google.com /
[39] Bio Golden Raand / Eneco / www.eneco.com/nl/
[40] Landfill Gas / Netherlands / Enipedia / enipedia.tudelft.nl /
[41] Port of Rotterdam. Facts & Figures (PDF) / Port of Rotterdam / www.portofrotterdam.com /
[42] The Country Report – The Netherlands (NL) (PDF) / IEA Bioenergy Task 42: Biorefining / www.iea-bioenergy.task42-biorefineries.com
[43] Large Industrial Users of Energy Biomass, September 2013 (PDF) / IEA Bioenergy Task 40 / bioenergytrade.org
[44] Netherlands / Waste-to-Energy / Energy / Industry About / www.industryabout.com
[45] Industrial Biorefineries and White Biotechnology… / Ashok Pandey, Rainer Höfer, Mohammad Taherzadeh, Madhavan Nampoothiri, Christian Larroche / Google Books / www.google.com
[46] MILENA Gasification process (PDF) / Energy Research Centre of the Netherlands (ECN) / www.ecn.nl
[47] Energie: inleiding en beleid / Compendium voor de Leefomgeving / www.clo.nl
[48] Energielabels van woningen, 2007 - 2016 / Compendium voor de Leefomgeving / www.clo.nl
[49] Stikstofinstallatie Zuidbroek / Rijksdienst voor Ondernemend Nederland / www.rvo.nl
[50] Wind op zee - Kavels I en II Hollandse Kust (zuid) / Rijksdienst voor Ondernemend Nederland / www.rvo.nl
[51] Doetinchem - Wesel 380 kV / Rijksdienst voor Ondernemend Nederland / www.rvo.nl
[52] Randstad 380 kV - Noordring / Rijksdienst voor Ondernemend Nederland / www.rvo.nl
[53] Zuid-West 380 kV west (Borssele-Rilland) / Rijksdienst voor Ondernemend Nederland / www.rvo.nl
[54] ROAD-project / Rijksdienst voor Ondernemend Nederland / www.rvo.nl
[55] FuelCellsWorks / New TU Delft ‘battolyser’ technology combines electricity storage and hydrogen production in a single system, enabling electricity to be stored efficiently and affordably / fuelcellsworks.com
[56] European Coal Map / Coal is a climate problem / www.coalmap.eu
The sources of charts and curves are specified under the images.
For more information about the energy industry in the Netherlands see here