
Contents
General State of the Economy
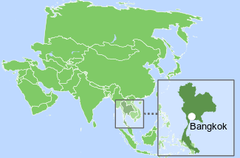
Thailand, officially the Kingdom of Thailand, is a country in Southeast Asia. It borders Laos and Cambodia to the east, Myanmar to the north-west, Malaysia to the south, and the Andaman Sea and the Gulf of Thailand to the west. The total length of the country's coastline is 3,219 km.
According to 2022 statistics, Thailand, which in terms of size is 53rd in the world, is home to around 67 million people. In terms of population density the country is 67th in the world out of 199 countries considered [1,2,3]. The administrative map of the country is divided into 76 provinces with Bangkok as its capital and by far the largest city. The political form of government is a constitutional monarchy, and the official language is Thai [3].
| Thailand | ||
|---|---|---|
| Capital: Bangkok | Density: 132.1/km2 | Currency: Baht (฿) (THB) |
| Official languages: Thai | Life expectancy at birth: 79.27 years | GDP (PPP): $1.665 trillion (2024 est.) |
| National Day: 5 December | Area (land): 513,120 km2 | GDP - per capita (PPP): $23,707 (2024 est.) |
| Population: 69,794,997 (2023 est.) | Coastline: 3,219 km | Internet country code: .th |
Source: [1,2,3,4,5]
The ranking positions of Thailand relative to other countries have been determined for an extensive list of economic, energy, innovative and educational indices, as well as for metrics reflecting the state of the environment. The economic indices include, for example, GDP per capita, annual average GDP growth, high-technology exports, and others. The list of energy indices includes proven reserves of oil, gas and coal, production-consumption ratio combined, and energy use, etc. Each of the indices has a ranked list of included member countries. Since the number of countries in each rating is different for each index, the positioning of the country of interest is displayed on a special chart, where the vertical axis is a uniform relative scale from 0 to 1, whereas the horizontal axis denominates the various indices and respective numbers relating to the descriptions given underneath.
Thus, in such a relative “0-1” diagram, the country’s position is marked with a dot in proportion to its location in the original rating list. If the country is among the leaders regarding the selected indicator, it will be marked close to 1 in the upper green zone on the relevant chart “0-1”, if the country is an outsider in the rating list, then it will be marked in the lower red zone of the chart “0-1”, etc. A single list of indices is used for all countries. If a country is not in the ranking list for any index, then the corresponding position on the charts is not displayed.
Ranking position of Thailand for list of economic indices:
| Sources: 1. GDP (purchasing power parity), 2020 est. / The World Factbook/Library/Central Intelligence Agency *228 2. GDP - per capita (PPP), 2020 / The World Factbook/Library/Central Intelligence Agency *229 3. Inflation rate (consumer prices), 2019 est. / The World Factbook/Library/Central Intelligence Agency *228 4. Charges for the use of intellectual property, receipts (BoP, current US$), 2020 / International Monetary Fund, Balance of Payments Statistics Yearbook, and data files. / License: CC BY-4.0 *88 5. The Global Competitiveness Index 2019 / Rankings / Reports / World Economic Forum *141 6. High-technology exports (current US$) 2019-2020 / United Nations, Comtrade database through the WITS platform / License: CCBY-4.0 / Data *134 7. 2021 Index of Economic Freedom / International Economies / The Heritage Foundation *178 8. Reserves of foreign exchange and gold, 2017 est. / The World Factbook / Library / Central Intelligence Agency *195 9. Annual average GDP growth in %, for the last 10 years (2011-2020) / World Bank national accounts data, and OECD National Accounts data files / License: CC BY-4.0 *206 10. Public debt (% of GDP), 2017 est. / The World Factbook / Library / Central Intelligence Agency (from smallest to largest) *210 * Total number of countries participating in ranking Figure 1. Economic Indices of Thailand |
For the majority of indices the positioning of Thailand is higher than the world average. Of the indices presented, the country has the highest values for Reserves of foreign exchange and gold (0.94), Gross Domestic Product based on purchasing power parity (0.91), High technology exports and Reserves (0.90), and the 2021 Index of Economic Freedom (0.76). The weakest spot within Thai economics is the Annual average GDP growth in % (0.48), the only one indicator where the country takes up a position below the middle of the rankings.
Energy Resources
Thailand has its own reserves of fossil fuels in the form of coal, natural gas and crude oil, but they are significantly lower than those of the world leaders. The share of coal is 0.1% of the world’s total, natural gas – 0.08%, and oil – 0.02% [6].
In terms of tons of oil equivalent, according to 2024 data, conventional proved reserves by fuel type were: 82.4% – coal, 13.8% – natural gas, and 3.8% – oil (Fig.5).
Table 1. Fossil energy resources of Thailand
| Resource /Explanations | Crude oil | Natural gas | Coal | Tight Oil | Shale Gas | Coal mine methane |
|---|---|---|---|---|---|---|
| Value | 0.253 (0.02%)* | 6.06 (0.08%)* | 1 171(0.1%)* | no date | no date | no date |
| Unit | billion barrels | Tcf | million short tons | - | - | - |
| Year | 2021 | 2020 | 2021 | - | - | - |
| Source | [6] | [6] | [6] | [-] | [-] | [-] |
* the share of the country’s reserves in world total is provided in brackets
Bioenergy plays a significant role in Thailand’s power generation, contributing about 70% to all renewable electricity produced in 2020, followed by solar PV (11.4%), hydropower (10.4%), and wind energy (8.1%). However, the country does not completely use its overall renewable energy potential.
This applies primarily to solar energy, the potential of which is quite high in Thailand, as the country is located in a tropical zone and therefore receives a lot of sunshine all year round. Thailand has several areas with high solar energy potential with the highest DNI solar intensity of 5.2-5.3 kWh/m2 per day recorded in the central part of country. Along the coast of the Gulf of the country as well as in some areas in the Petchburi Province there is a good potential for wind power with the wind speed reaching 6.5 m/s at a height of 50 m.
THAILAND, LOEI AGROMET
Latitude: 17.4 Longitude: 101.73
Average daily sky coverage over 10 years of observations, %
CLR - clear, SCT - scattered from 1/8 TO 4/8, BKN - broken from 5/8 TO 7/8, OVC - overcast, OBS - obscured, POB - partial obscuration
Source: based on NOAA U.S. Department of Commerce
THAILAND, LAEM CHABANG
Latitude: 13.08, Longitude: 100.88
Average speed: 3.91 m/s, Operational share: 62%
Average daily wind speed for 10 years of observations, m/s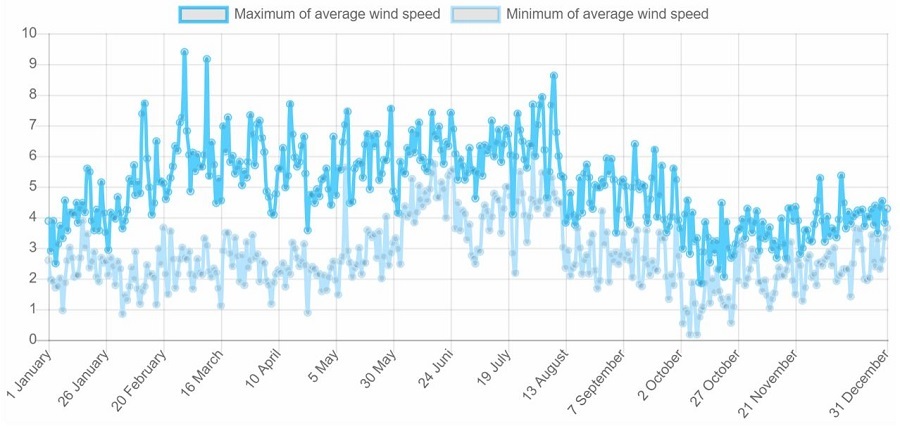
Source: based on NOAA U.S. Department of Commerce
According to Thailand's Ministry of Energy, the country's hydropower potential is estimated at 15,155 megawatts. The development of hydro resources is rather limited and small-scale projects are considered the most economical and environmentally friendly.
Table 2. Renewable energy resources of Thailand
| Resource/ Explanations | Solar Potential (GHI)* | Wind Potential (50 м)* | Bio Potential (agricultural area) | Bio Potential (forest area) | Municipal Solid Waste |
|---|---|---|---|---|---|
| Value | 4.0-5.2 | 4.5-6.5 | 45.0 | 38.9 | 1.08 |
| Unit | kWh/m2/day | m/s | % of land area | % of land area | kg/per capita/day |
| Year | 2020 | 2020 | 2020 | 2020 | 2018 |
| Source | [7] | [8] | [9] | [10] | [11] |
*for the majority of the territory of the country
Thailand's diverse ecosystems, including a rather extensive agricultural and forest area forms a decent resource base for the development of a number of bioenergy technologies, in particular, the production of biogas, bioethanol or biodiesel.
Energy Balance
According to [6], in 2022 in Thailand, the total production of primary energy was 2.156 quadrillion Btu, while consumption was at the level of 5.016 quadrillion Btu. Thus, the share of domestic production in primary energy consumption was 42.98%. This makes Thailand a country highly dependent on energy imports.
According to the Statistical Review of World Energy 2022, primary energy consumption in Thailand in 2021 amounted to 5.11 exajoules and was dominated by oil – 44%, followed by natural gas – 33.1%, coal – 15.85%, renewables – 6.25%, and hydroelectricity – 0.78% [12].
Source: U.S. Energy Information Administration (Mar 2024) / www.eia.gov
Figure 2. The Production and Consumption of fossil fuels in Thailand (left — coal, in the center — gas, right — oil)
Although fossil fuel consumption has increased in recent years, their production in Thailand lags far behind the demand. In 2022, the consumption of coal and oil was more than twice as high as production. Natural gas consumption is approximately one-third higher than its domestic production.
Sources: U.S. Energy Information Administration (Mar 2024) / www.eia.gov | ||
| Figure 3. Electricity Generation in Thailand |
Total electricity generation in Thailand has grown by about 20% over the past ten years. In 2022, approximately 82% of electricity was produced by thermal power plants, 14% – by non-hydro renewable sources and 4% – by hydroelectric power plants. The country has been experiencing a shortage of domestically produced electricity since 2015, and in 2022 about 11% of electricity was imported.
| Sources: 1. Crude oil proved reserves, 2021 / International Energy Statistic/Geography / U.S. Energy Information Administration (Nov 2021)*98 2. Natural gas proved reserves 2021 / International Energy Statistic / Geography / U.S. Energy Information Administration (Nov 2021) *99 3. Total recoverable coal reserves 2019 / International Energy Statistic / Geography / U.S. Energy Information Administration (Nov 2021) *81 4. Combination production-consumption for Crude oil 2018 / International Energy Statistic / Geography / U.S. Energy Information Administration (Nov 2021) *219 5. Combination production-consumption for Natural gas 2019 / International Energy Statistic / Geography / U.S. Energy Information Administration (Nov 2021) *123 6. Combination production-consumption for Coal 2019 / International Energy Statistic / Geography / U.S. Energy Information Administration (Nov 2021) *128 7. Electricity – from other renewable sources (% of total installed capacity), 2017 est. / The World Factbook / Library / Central Intelligence Agency *170 8. GDP per unit of energy use (PPP per unit of oil equivalent), 2020 *66 Primary energy consumption - BP Statistical Review of World Energy 2021/BP;GDP (purchasing power parity) - The World Factbook/Library/Central Intelligence Agency 9. Energy use (primary energy use of oil equivalent per capita) 2020 *127 Primary energy consumption – BP Statistical Review of World Energy 2021; Population - United Nations, Department of Economic and Social Affairs, Population Division (2019). World Population Prospects 2019, custom data acquired via website. Retrieved 15 November 2021*66 10. The Global Energy Architecture Performance Index Report (EAPI) 2017 / Rankings / Reports / World Economic Forum 11. Electric power consumption (kWh per capita), 2016 *217 Electricity Consumption - The World Factbook / Library / Central Intelligence Agency; Population - United Nations, Department of Economic and Social Affairs, Population Division (2019). World Population Prospects 2019, custom data acquired via website. Retrieved 15 November 2021 12. Combination of electricity production-consumption (kWh)/The World Factbook/Library/Central Intelligence Agency *216 * Total number of countries participating in ranking Figure 4. Energy indices of Thailand |
Thailand's energy indices, as reflected in the above graph, demonstrate the country's challenging situation in the energy sector. On the one hand, the country's fossil reserves – coal (0.58), gas (0.54), and oil (0.47) – are at about the world average level, but the generation to consumption ratio is very low because the country's energy needs are much higher than its domestic capacity. This is also the case for the electricity consumption-generation combination, which is the lowest indicator (0.02) of those presented. The highest indicator for Thailand depicted in the ranking is Electricity from renewable sources as % of total installed capacity (0.68).
Energy Infrastructure
A territorial map showing distribution of the largest infrastructure projects of the fossil fuel sector in Thailand is displayed in Figure 5. As previously mentioned, coal reserves account for 82.4% of all proven reserves of fossil fuels, natural gas – for 13.8%, and oil – for 3.8%.
Bangkok, Thailand
Mae Moh Mine located in the mountains of the Lampang province in the northern part of the country is Thailand's largest coal mine. Located in the same area, one of the biggest coal-fired power plants in Southeast Asia, the 2,400 MW Mae Moh power station, is fueled by coal mined here. 
Figure 5. Basic infrastructure facilities of the fossil fuel sector in Thailand
There are many petroleum and natural gas fields in Thailand both onshore and offshore. However, the majority of Thailand's natural gas and oil production comes from offshore fields located in the Gulf of Thailand, predominantly from the Pattani Basin and the Malay Basin.
Figure 6. Electricity production in Thailand
Thailand's power generation mix is dominated by fossil fuels. According to the Energy Policy and Planning Office of Thailand [13], about 58% of Thailand's electricity is generated by natural gas as of 2022, compared to a high point of 70.5% in 2015. Most of the gas-fired power plants are concentrated in the central part of the country, linked to the domestic offshore fields of the Gulf of Thailand.
As of 2022, hydropower in Thailand accounts for 3.7% of electricity generated. The biggest hydroelectric dam in Thailand is the Bhumibol Dam on the Ping River, in the Tak Province.
Thailand has set targets and policies for the country's energy sector development for 2036, prioritizing local renewable energy sources, including hydropower and reducing the share of natural gas. However, experts believe that demand for fossil fuels will grow rapidly over the next decade and natural gas will remain the dominant source of electricity generation in 2036 [14].
Figure 7. Renewable energy in Thailand: Geothermal, Hydrogen, Solar, Wind
As noted, Thailand has abundant solar energy resources, with high irradiance in the northeastern and central parts of the country, where most solar power plants are concentrated. In addition, the renewable energy infrastructure includes a number of wind farms, with a total capacity of approximately 15,000 MW as of 2022 [13].
In its Alternative Energy Development Plan (AEDP) 2018-2037, Thailand has set a new renewable energy target of 30% of total final energy consumption and meeting about 34% of net national electricity demand from renewable sources by 2037. In addition, the plan aims to achieve the following renewable energy capacities by 2037: 15.6 GW of solar, 5.8 GW of biomass, 3 GW of wind, 3 GW of hydropower, and 0.9 GW from waste [15].
Figure 8. Renewable energy in Thailand: Bioenergy
Figure 8 shows the main bioenergy objects of the country for energy production. In 2021, bioenergy dominated renewable energy in Thailand, accounting for 70.3% of all alternative generation. The country's bioenergy infrastructure includes biomass and biogas power plants as well as waste-to-energy and wood pellet plants. In addition, biofuel production has become a common practice in Thailand and there are many bioethanol and biodiesel plants in the country. According to IRENA [14], the share of renewable energy for transportation in total renewable energy use in Thailand is expected to increase significantly by 2036. Biofuels, namely biodiesel from palm oil and bioethanol from cassava and sugarcane, account for two-thirds of the total renewable energy expected to be used in the transportation sector. In addition, significant growth is expected in compressed biogas production from waste and energy crops, which could provide 6% of the transportation sector's energy by 2036.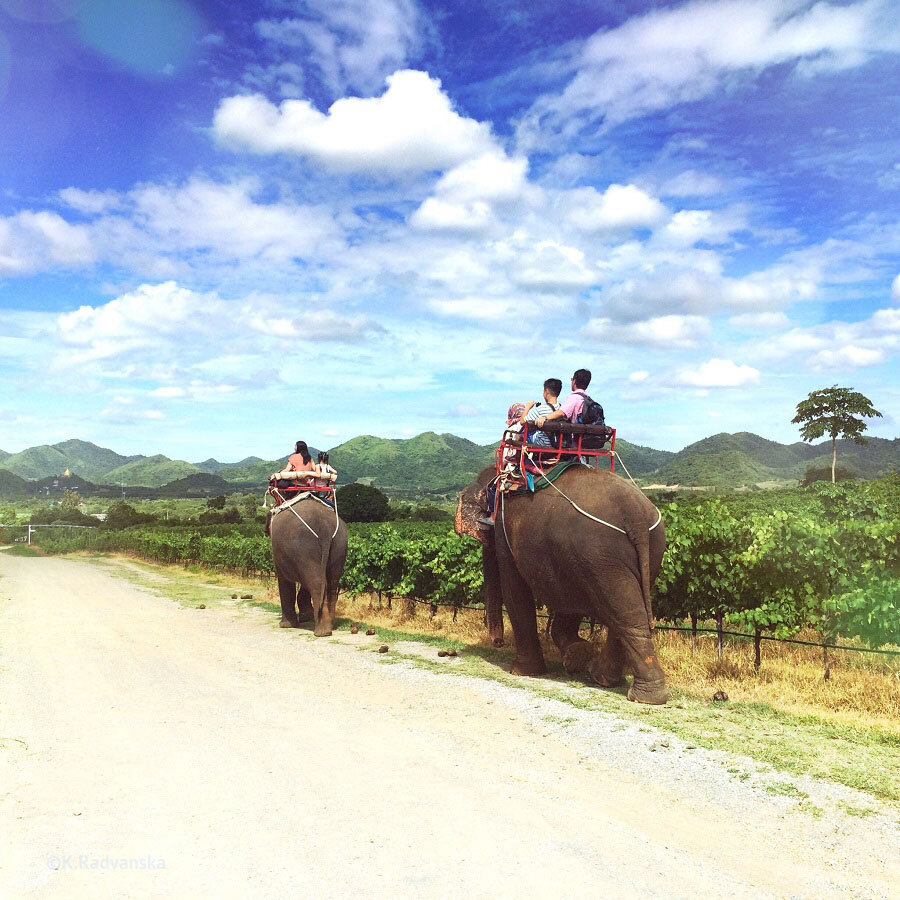
Elephant travel, Thailand
Being an agricultural country, Thailand has a large amount of agro-industrial waste, mainly solid waste from rice, corn, sugarcane and palm production, which is far from being fully utilized. Experts believe that biomass waste could cover up to 15% of Thailand's energy needs. The government has launched a statewide initiative to introduce biomass as an important energy source, and by 2031, biomass power generation is expected to increase by 80% to about 8.45 GW, up from 4.7 GW generated in 2021 [16].
Education and Innovation
The following chart shows Thailand's positions in terms of education and innovation:
Sources: 1. The Global Innovation Index 2021, Rankings / Knowledge / World Intellectual Property Organization / Cornell University, INSEAD, and WIPO (2021): Energizing the World with Innovation. Ithaca, Fontainebleau, and Geneva *132 2. Patent Grants 2011-2020, resident & abroad / Statistical country profiles / World Intellectual Property Organization *185 3.Patents in Force 2020 / Statistical country profiles / World Intellectual Property Organization *109 4. QS World University Rankings 2022 *97 5. SCImago Country Rankings (1996-2020) / Country rankings / SCImago, (n.d.). SIR-SCImago Journal & Country Rank [Portal]. Retrieved 17 Nov 2021 *240 6. Internet users in 2018 / The World Factbook / Central Intelligence Agency *229 7. Internet users in 2018 (% Population) / The World Factbook / Central Intelligence Agency *229 8. Government expenditure on education, total (% of GDP), 2019 / United Nations Educational, Scientific, and Cultural Organization (UNESCO) Institute for Statistics. License: CCBY-4.0 / Data as of September 2021*177 9. Research and development expenditure (% of GDP), 2018 / UNESCO Institute for Statistics. License: CCBY-4.0 / Data *119 10. Scientific and technical journal articles, 2018 / National Science Foundation, Science and Engineering Indicators. License: CCBY-4.0 / Data *197 * Total number of countries participating in ranking | ||
| Figure 9. The indices of education and innovation in Thailand |
Most of the indicators that characterize Thailand's position in various international rankings related to education and innovation are above the world average. Among them, Thailand's best indicators relate to the Scientific and technical journal articles (0.84), the SCImago Country Rankings (0.82), and Patents in force (0.73). The country has the highest ranking in terms of absolute number of internet users (0.91), but when looking at the number of users as a proportion of the country's entire population, this is one of the lowest country indicators presented in the chart (0.44).
Ecology and Environment Protection
Indicators related to environmental issues are presented in the following diagram:
| Sources: 1. CO2 total emission by countries 2020 / European Commission / Joint Research Centre (JRC) / Emission Database for Global Atmospheric Research (EDGAR)*208 2. CO2 per capita emission 2020/European Commission/Joint Research Centre (JRC) / Emission Database for Global Atmospheric Research (EDGAR) *208 3. Forest area 2020 (% of land area) / The Global Forest Resources Assessment 2020 / Food and Agriculture Organization of the United Nations *234 4. Forest area change 2010-2020 (1000 ha/year) / The Global Forest Resources Assessment 2020 / Food and Agriculture Organization of the United Nations *234 5. The Environmental Performance Index (EPI) 2020 / Rankings / Yale Center for Environmental Law & Policy / Yale University *180 6. Annual freshwater withdrawals (m3 per capita), 2017 *179 Annual freshwater withdrawals, total (billion m3), 2017 – Food and Agriculture Organization, AQUASTAT data. /License: CC BY-4.0; Population – United Nations, Department of Economic and Social Affairs, Population Division (2019). World Population Prospects 2019, custom data acquired via website. Retrieved 15 November 2021 7. The National Footprint Accounts 2017 (Biocapacity Credit / Deficit) / Global Footprint Network *188 8. Methane emissions (kt of CO2 equivalent), 2018 / Data for up to 1990 are sourced from Carbon Dioxide Information Analysis Center, Environmental Sciences Division, Oak Ridge National Laboratory, Tennessee, United States. Data from 1990 are CAIT data: Climate Watch. 2020. GHG Emissions. Washington, DC: World Resources Institute. Available at: License : Attribution-NonCommercial 4.0 International (CC BY-NC 4.0) *191 9. The Climate Change Performance Index (CCPI) 2022 / Overall Results / Jan Burck, Thea Uhlich, Christoph Bals, Niklas Höhne, Leonardo Nascimento / Germanwatch, NewClimate Institute & Climate Action Network *60 * Total number of countries participating in ranking | ||
| Figure 10. Environmental Indices of Thailand |
Thailand belongs to the group of countries with the largest amount of carbon dioxide (0.12) and methane emissions (0.08). In Thailand, as can be seen from the diagram, the area of forests is higher than the world average (0.62), but their number has shown a steady decreasing trend in recent years (0.18). Among the country's positive environmental characteristics is its annual freshwater withdrawal (0.82), which is relatively high, compared to other countries. In general, the environmental situation in Thailand requires significant improvement.
References
[1] List of sovereign states and dependencies by area / Wikipedia / https://en.wikipedia.org/wiki/List_of_sovereign_states_and_dependencies_by_area
[2] List of countries and dependencies by population density / Wikipedia / https://en.wikipedia.org/wiki/List_of_countries_and_dependencies_by_population_density
[3] Thailand / The-world-factbook / Library / Central Intelligence Agency / https://www.cia.gov/
[4] GDP, PPP (constant 2011 international $) / World Bank, International Comparison Program database. License: CC BY-4.0 / Data / The World Bank / http://www.worldbank.org/
[5] GDP per capita, PPP (current international $)/ World Bank, International Comparison Program database. License: CC BY-4.0 / Data / The World Bank / http://www.worldbank.org/
[6] International Energy Statistic / Geography / U.S. Energy Information Administration / http://www.eia.gov/
[7] Solar resource data obtained from the Global Solar Atlas, owned by the World Bank Group and provided by Solargis / Global Solar Atlas / http://globalsolaratlas.info/
[8] Wind Map / Global Wind Atlas 2.0, a free, web-based application developed, owned and operated by the Technical University of Denmark (DTU) in partnership with the World Bank Group, utilizing data provided by Vortex, with funding provided by the Energy Sector Management Assistance Program (ESMAP). For additional information: https://globalwindatlas.info
[9] Agricultural land (% of land area) / Food and Agriculture Organization, electronic files and web site. License: CC BY-4.0 / Data / The World Bank / http://www.worldbank.org
[10] Forest area (% of land area) /Food and Agriculture Organization, electronic files and web site. License: CC BY-4.0 / Data / The World Bank / http://www.worldbank.org
[11] World Bank What a Waste / Data / The World Bank / http://www.worldbank.org
[12] BP Statistical Review of World Energy 2020 - 2022 (PDF) / BP / https://www.bp.com/
[13] Energy Policy and Planning Office of Thailand / Energy Statistics / www.eppo.go.th/index.php/en/
[14] RENEWABLE ENERGY OUTLOOK THAILAND / IRENA / www.irena.org/-/media/files/irena/agency/publication/2017/nov/irena_outlook_thailand_2017.pdf
[15] THAILAND: Alternative Energy Development Plan 2018-2037 (AEDP 2018-2037) / Ministry of Energy / policy.asiapacificenergy.org
[16] Thailand’s PM Greenlights Biomass Projects / 3 August 2022 / Enlit Asia / www.enlit-asia365.com/renewables/thailands-pm-greenlights-biomass-projects/
The sources of charts and curves are specified under the images.
For more information about the energy industry in Thailand see here