
Aenert news. Energy Market & Energy Statistics
According to a recent report from the US Energy Information Administration, the country's oil and gas production continued to record growth in the fourth quarter of 2023. Thus, crude oil production increased by 1.7% compared to the previous quarter to 13,284 Thousand Barrels per Day, which was the highest achievement for the entire period of recording this indicator. At the end of 2023, it reached 12,933 Thousand Barrels per Day against 11,911 thousand barrels per day in 2022 (+ 8.6%). This impressive growth in crude oil production was mainly achieved in the second half of the year, especially in the last quarter. Last year, the gap between exports and imports of crude oil also continued to widen, and the average annual Net imports reached 1,636 thousand barrels per day, while in 2022 it was 1,191. After the traditional peak in the third quarter, Refinery and Blender Net in 2023Q4 decreased to 18,247 Thousand Barrels per Day, which is 3.5% less than in 2023Q3, but 6.3% more than in the same quarter a year earlier.
The natural gas sector demonstrated no less convincing performance. Dry Natural Gas Production in 2023 increased by more than 4% to 9,712 Billion Cubic Feet. Particularly significant was the growth in natural gas exports, which reached 2016 Billion Cubic Feet in the fourth quarter. This is immediately 18.2% more than a year earlier. At the end of 2023, gas exports amounted to 7,611 Billion Cubic Feet versus 6,904 in 2022 (+10.2%).
Production of energy products in the US, 2022 Q4 - 2023 Q4
| Energy Indicator/Q | 2022 Q4 | 2023 Q1 | 2023 Q2 | 2023 Q3 | 2023 Q4 |
|---|---|---|---|---|---|
| Crude Oil, Field Production (Thousand Barrels per Day) | 12298 | 12596 | 12710 | 13058 | 13284 |
| Crude Oil, Refinery and Blender Net Inputs (Thousand Barrels per Day) | 17172 | 17572 | 18897 | 18915 | 18247 |
| Dry Natural Gas Production (Billion Cubic Feet) | 9214 | 9180 | 9354 | 9571 | 9712 |
| Natural Gas Exports, Total (Billion Cubic Feet) | 1705 | 1829 | 1867 | 1894 | 2016 |
| Coal Production (Thousand Short Tons) | 145666 | 148706 | 142338 | 145605 | 143373 |
| Electricity Net Generation (Billion Kilowatthours) | 1001 | 987 | 985 | 1208 | 998 |
Source: Based on U.S. Energy Information Administration
Of course, looking at these impressive data, the most exciting question is whether American manufacturers will be able to maintain these figures this year and beyond for the near future. Much will be determined by world oil prices, which few can correctly predict. In addition, an important component is the financial condition of oil companies. We mentioned the state of the shale gas and tight oil sector in the United States, which form the basis of the oil and gas industry, when analyzing the quarterly reports of some significant companies operating in this sector. The overall conclusion was optimistic.
However, it was noted that total tight oil production in the fourth quarter of 2023 fell for the first time in recent years to 8.24 from 8.42 million barrels of oil per day in the third quarter of 2023. This was primarily due to a significant decrease in the number of wells drilled, especially in the second half of 2023, and an increase in drilling trajectories. At the same time, first, the number of drilled vertical wells decreased, while the number of horizontal wells increased. The total number of oil wells in the US in 2023 was 12,469, down from 12,971 in 2022, a decline of nearly 4%. Judging by the data for January and February 2024, this decline continued. Perhaps this is an indicator of a further reduction in oil production, although we emphasize once again that for this to happen, other indicators and, above all, world oil prices must move towards a reversal.
Net Generation, after record seasonal values in 2023Q3, decreased noticeably in the last quarter of last year, but remained almost at the level of 2022Q4. In general, Net Generation in 2023 was 1.25% less than in 2022.
Electric power generation in the US by source type in 2022 Q4 – 2023 Q4
Source: Based on U.S. Energy Information Administration
The structure of electricity generation in the fourth quarter of 2023 underwent significant changes compared to the same quarter last year. First, the share of coal generation dropped noticeably from 19.1 to 16.5%. However, at the same time, the share of gas and nuclear generation increased by 1.9% and 0.2%, respectively. Solar energy showed significant growth – from 2.8 to 3.5%.
Percentage of electric power generation by source type in 2022 Q4 and 2023 Q4

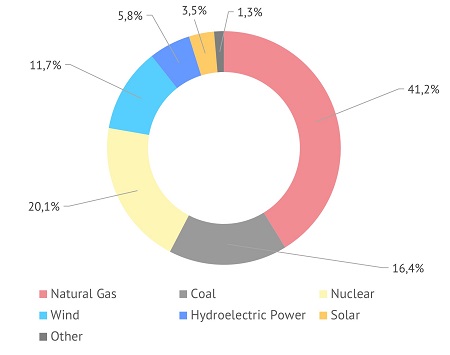
Source: Based on U.S. Energy Information Administration
Overall, the share of solar, wind and hydropower increased by almost 1%.
By the Editorial Board