
Aenert news. Energy Market & Energy Statistics
The economy of the European Union is not in the best shape, although according to Eurostat statistics, individual record figures were achieved in the third quarter of 2023. For example, Gross domestic product increased to 4,221,767.8 million Euros, which is 5.5% higher than in the same quarter a year earlier. In addition, most countries are characterized by an increase in the Final consumption expenditure of households index.
However, there are several pain points that are fueling the perception of a possible economic recession. To do this, just look at the diagrams of changes in Production in industry and Exports of goods and services. Both indicators within the framework of aggregated data for the European Union show a significant decrease for the fourth quarter in a row.
Volume index of production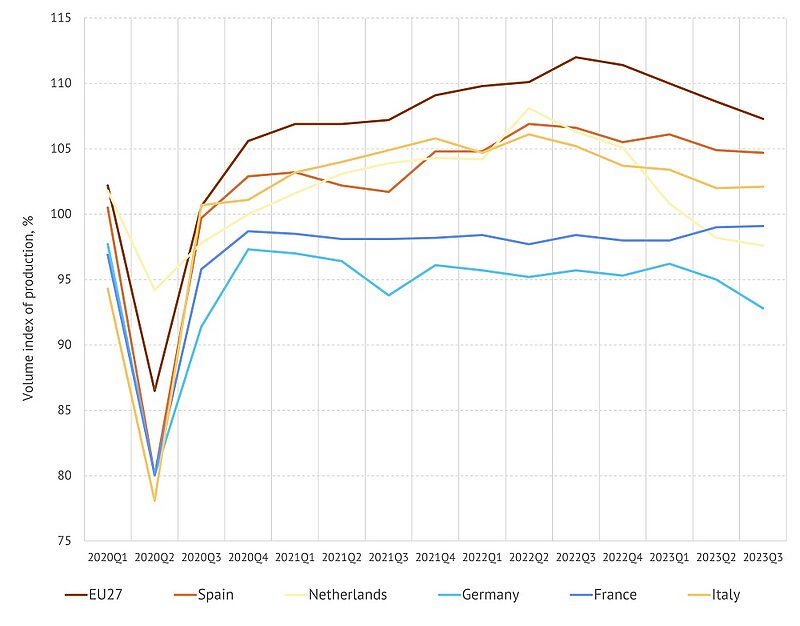
Source: Based on Eurostat
Production in industry index for 27 EU countries, which includes data on mining and quarrying; manufacturing; electricity, gas, steam and air conditioning supply, in 2023Q3 amounted to 107.3% (2015 – 100%), which overall looks good. However, it should be taken into account that in Germany this indicator was only 92.8, in France - 99.1, in the Netherlands - 97.6. Particularly significant is the serious decline in this indicator for Germany and the Netherlands, which are among the five largest economies of the European Union.
Exports of goods and services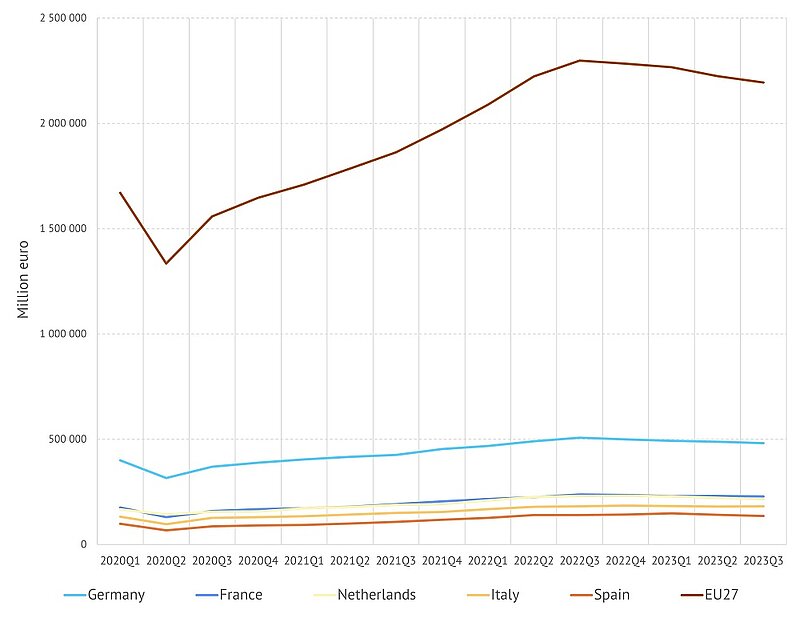
Source: Based on Eurostat
Total exports to third countries of suppliers from the European Union in 2023 Q3 were recorded at 2,193,923 million euros, while in 2022 Q3 it was noticeably higher – 2,298,527.1. For Germany, respectively, 481,980 million euros and 507,145 million euros. It should be noted that this trend is typical for most countries from among the largest economies of the EU 27.
EU energy statistics, natural gas, oil and electricity, 2022 Q3 - 2023 Q3
| Energy Indicator/Q | 2022 Q3 | 2022 Q4 | 2023 Q1 | 2023 Q2 | 2023 Q3 |
|---|---|---|---|---|---|
| Production of natural gas, TJ | 393383,3 | 399867,0 | 391095,9 | 327990,5 | 317595,0 |
| Total consumption of natural gas, TJ | 2287808,5 | 3666085,8 | 4361503,6 | 2509349,6 | 2160241,7 |
| Imports of natural gas, TJ | 5354876,8 | 5230047,1 | 4661838,6 | 4874738,8 | 4289148,0 |
| Imports of crude oil - 1000t | 123139,2 | 120365,4 | 115482,2 | 114811,4 | 122503,0 |
| Production of electricity - GWh | 623534,4 | 657128,9 | 700035,7 | 598157,0 | 600956,5 |
| Consumption of electricity - GWh | 589900,7 | 607804,8 | 643041,0 | 558213,4 | 569138,3 |
| Imports of electricity - GWh | 103345,0 | 109761,0 | 104254,6 | 93238,3 | 100796,9 |
*Import of crude oil for Poland for September 2023 are taken equal to those for August
Source: Based on Eurostat
The indicators for the main types of energy products in the European Union decreased significantly compared to the data for the same quarter last year. Thus, the volumes of natural gas consumption in 2023Q3 were 5.6% lower than in 2023Q2, the production and import of natural gas fell by almost 20%, electricity generation decreased by 3.6%, and electricity consumption by 3.5%. Imports of oil and electricity decreased to a lesser extent.
When comparing data from the third and second quarters of 2023, what primarily attracts attention is the significant decrease in consumption and import of natural gas - by 14 and 12%, respectively. It is obvious that these indicators are inextricably linked with the previously mentioned Production in industry, which was also subject to a significant reduction.
A more detailed monthly breakdown of this data is presented in the figures below.
Monthly EU natural gas production and consumption, gas and oil import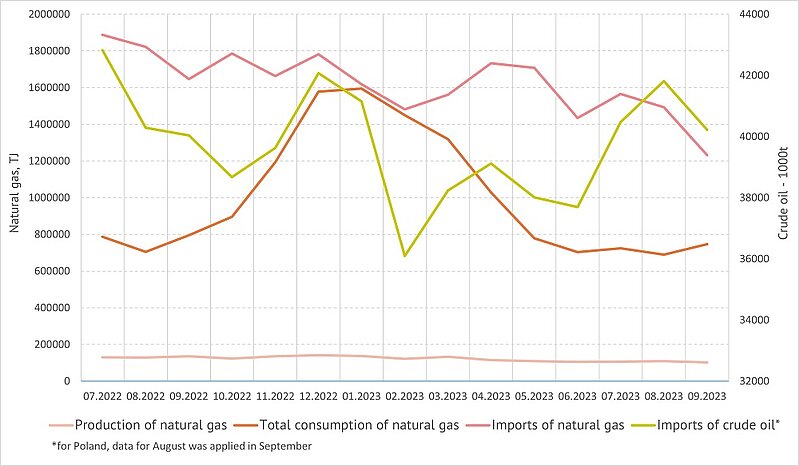
Source: Based on Eurostat
According to electricity generation statistics, there was a slight increase in fossil fuel use in the last quarter.
Monthly EU electricity production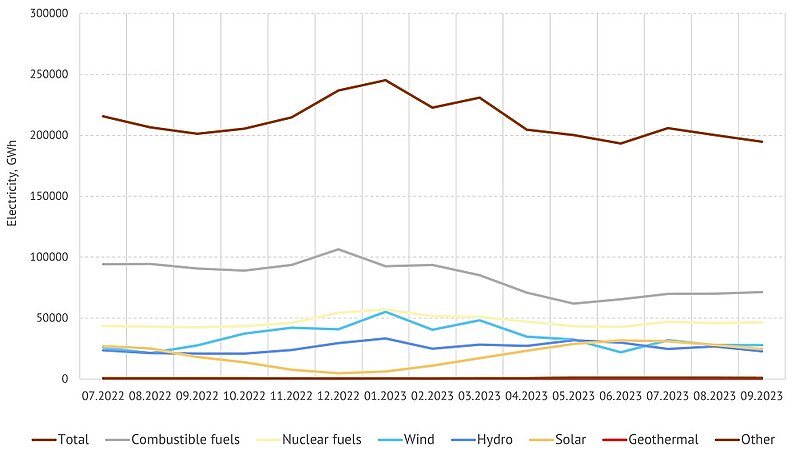
Source: Based on Eurostat
However, over the last four quarters, there have been major changes in the generation structure in favor of renewable energy sources. The share of hydropower increased by 1.8%, solar and wind power by 2.6% in each case. In addition, electricity generation at nuclear power plants increased by 2.5%. This led to a decrease in the share of use of natural gas, coal and oil by 9.6%. Impressive result.
Percentage of electric power generation by source type in 2022 Q3 and 2023 Q3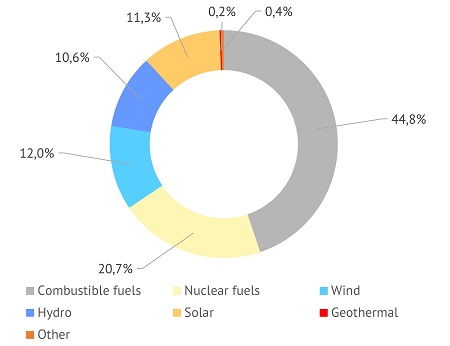
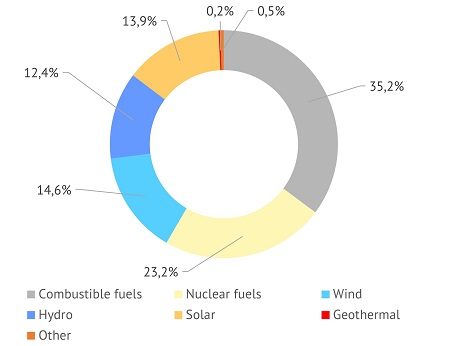
Source: Based on Eurostat
By the Editorial Board