
Aenert news. Energy Market & Energy Statistics
Eurostat has published a complete package of data on energy production, consumption and imports for the second quarter of 2023. As follows from the table below, all indicators have undergone a significant decline over the past year.
So, when comparing 2022 Q2 and 2023 Q2, the production and consumption of natural gas decreased by 17% and 8%, respectively. At the same time, natural gas imports practically collapsed by almost 23%. The decline in electricity production, consumption and imports was more subdued. The volume of oil imports decreased by 5.5%.
A similar situation arose when comparing data from the first and second quarters of this year. The only indicator for which a slight increase was detected relates to natural gas imports. However, against this background, gas consumption fell by more than 40%.
EU energy statistics, natural gas, oil and electricity, 2022 Q2 - 2023 Q2
| Energy Indicator/Q | 2022 Q2 | 2022 Q3 | 2022 Q4 | 2023 Q1 | 2023 Q2 |
|---|---|---|---|---|---|
| Production of natural gas, TJ | 398924.5 | 393383.3 | 399867.0 | 391128.6 | 332006.0 |
| Total consumption of natural gas, TJ | 2731639.5 | 2297520.0 | 3674240.4 | 4360394.1 | 2510190.1 |
| Imports of natural gas, TJ | 6296600.5 | 5354419.6 | 5229571.5 | 4660172.1 | 4870151.9 |
| Imports of crude oil - 1000t | 121560.7 | 123139.2 | 120263.0 | 115481.9 | 114811.4 |
| Production of electricity - GWh | 626573.7 | 623508.5 | 657118.4 | 698955.2 | 598134.2 |
| Consumption of electricity - GWh | 593339.6 | 589922.7 | 608161.5 | 641917.3 | 556820.2 |
| Imports of electricity - GWh | 101260.8 | 103336.0 | 109761.0 | 104383.3 | 93238.9 |
Source: Based on Eurostat
Natural gas consumption fell across the European Union for the fifth month in a row after booming in the second half of last year. The largest fluctuations in monthly indicators are typical for crude oil imports.
Monthly EU natural gas production and consumption, gas and oil import
Source: Based on Eurostat
For electricity production, the most dramatic changes relate to the use of combustible fuels, where a steady decline is observed. On the other hand, electricity generation through photovoltaics has increased for the sixth month in a row.
Monthly EU electricity production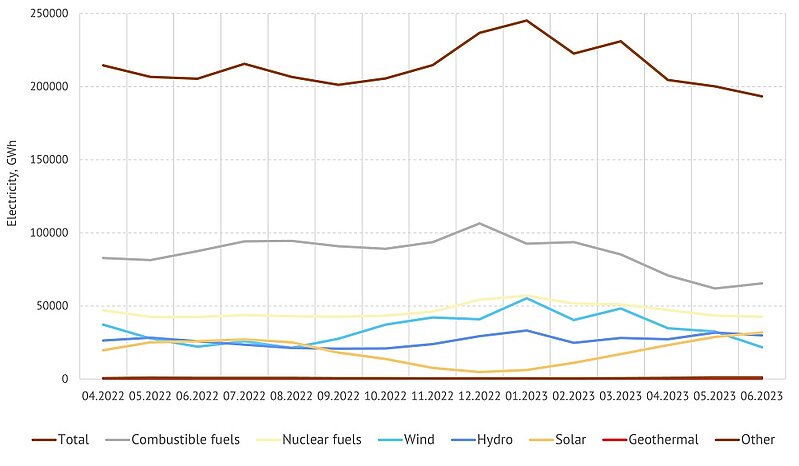
Source: Based on Eurostat
In 2023 Q2, the share of fossil fuel use in the energy sector decreased by 7% compared to 2022 Q2. On the contrary, the shares in electricity generation for other technologies have increased significantly. For solar energy, the share growth was almost 3%, for wind energy – 1%, for hydropower – 2.1%, for nuclear energy – 1.2%.
Percentage of electric power generation by source type in 2022 Q2 and 2023 Q2


Source: Based on Eurostat
By the Editorial Board