
Aenert news. Energy Market & Energy Statistics
According to recently published data from the National Bureau of Statistics of China for the fourth quarter of 2023, the country's gross domestic product (100 million yuan) amounted to 347,890.1 versus 333,990.7 in the same quarter a year earlier (an increase of 4.2%). At the same time, the industrial capacity utilization rate of industrial enterprises throughout the country was at the level of 75.9 percent, which is 0.2 percentage points more than in the same period last year, and 0.3 percentage points than in the previous quarter. As a result, in 2023, the country's industrial capacity utilization rate was 75.1 percent, which is 0.5 percentage points lower than in the previous year.
The main indicators of consumption and production of energy products in China in 2023 Q4 compared to last year's data showed strong growth. The growth in imports of coal and natural gas was especially strong (37.24 and 14.8%%, respectively). Production of crude oil increased by 2.5%, petroleum products by 3%, natural gas by 2.65%, and electricity generation by 8.6%.
China Energy Production 2022 Q4 - 2023 Q4
| Production/Q | 2022 Q4 | 2023 Q1 | 2023 Q2 | 2023 Q3 | 2023 Q4 |
|---|---|---|---|---|---|
| Production of Crude Oil (average daily output, thousand tons) | 553 | 583 | 581 | 561.3 | 567 |
| Processing Capacity of Industrial Crude Oil (average daily Processing Capacity, thousand tons) | 1936.7 | 2004.5 | 2023.3 | 2081.7 | 1995 |
| Production of Natural Gas (average daily output, million cubic meters) | 630 | 665 | 616.7 | 590.0 | 646.7 |
| Industrial Power Generation (Average Daily Power Generation, TWh) | 22.66 | 23.01 | 22.94 | 26.47 | 24.61 |
| Import of crude oil (average monthly, thousand tons) | 45 983 | 45 463 | 48 636.7 | 47 410 | 46 539 |
| Import of natural gas (average monthly import, thousand tons) | 9 403 | 8 933 | 10 003 | 10 440 | 10 797 |
| Raw Coal Production (average monthly, million tons) | 388.03 | 383.8 | 385.67 | 384.23 | 405.69 |
| Coal Import (average monthly, million tons) | 30.8 | 33.9 | 40.0 | 41.91 | 42.27 |
Source: based on National Bureau of Statistics of China
The dynamics of changes in the total volume of electricity generation, as well as its components, are shown in the figure below.
Electricity Generation by type energy source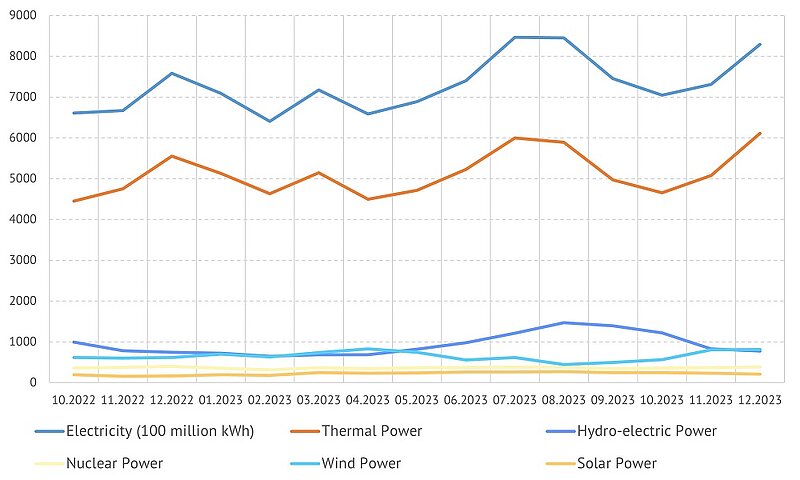
Source: based on National Bureau of Statistics of China
During 2024, major changes occurred in the electricity generation structure. When comparing data for 2023Q4 and 2022Q4, the following should be noted. The share of wind energy increased by 0.8%, and solar energy by 0.5%.
The share of power generation sources. Left – 2022 Q4, right – 2023 Q4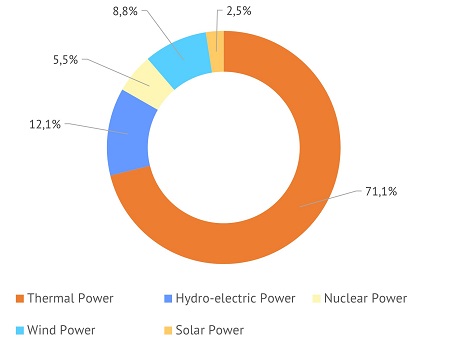

Source: based on National Bureau of Statistics of China
At the same time, the share of electricity generation from fossil fuels decreased by 1.1% to 70.0%. However, this is approximately twice as much as in the countries of the European Union and one and a half times more than in the United States.
By the Editorial Board