
Aenert news. Energy Market & Energy Statistics
根据中国国家统计局近日公布的2023年第四季度数据,国内生产总值(亿元)达347,890.1,上年同期为333,990.7(增长4.2%)。与此同时,全国工业企业产能利用率为75.9%,比去年同期提高0.2个百分点,比上季度提高0.3个百分点。预计2023年全国工业产能利用率为75.1%,比上年下降0.5个百分点。
2023年四季度我国能源产品消费和生产主要指标与去年数据相比均呈现强劲增长。煤炭和天然气进口增长尤为强劲(分别为37.24%和14.8%)。原油产量增长2.5%,石油产品产量增长3%,天然气产量增长2.65%,发电量增长8.6%。
中国能源生产 2022 年第四季度 - 2023 年第四季度
| Production/Q | 2022 Q4 | 2023 Q1 | 2023 Q2 | 2023 Q3 | 2023 Q4 |
|---|---|---|---|---|---|
| Production of Crude Oil (average daily output, thousand tons) | 553 | 583 | 581 | 561.3 | 567 |
| Processing Capacity of Industrial Crude Oil (average daily Processing Capacity, thousand tons) | 1936.7 | 2004.5 | 2023.3 | 2081.7 | 1995 |
| Production of Natural Gas (average daily output, million cubic meters) | 630 | 665 | 616.7 | 590.0 | 646.7 |
| Industrial Power Generation (Average Daily Power Generation, TWh) | 22.66 | 23.01 | 22.94 | 26.47 | 24.61 |
| Import of crude oil (average monthly, thousand tons) | 45 983 | 45 463 | 48 636.7 | 47 410 | 46 539 |
| Import of natural gas (average monthly import, thousand tons) | 9 403 | 8 933 | 10 003 | 10 440 | 10 797 |
| Raw Coal Production (average monthly, million tons) | 388.03 | 383.8 | 385.67 | 384.23 | 405.69 |
| Coal Import (average monthly, million tons) | 30.8 | 33.9 | 40.0 | 41.91 | 42.27 |
Source: based on National Bureau of Statistics of China
发电总量及其组成部分的变化动态如下图所示。
分能源发电量 资料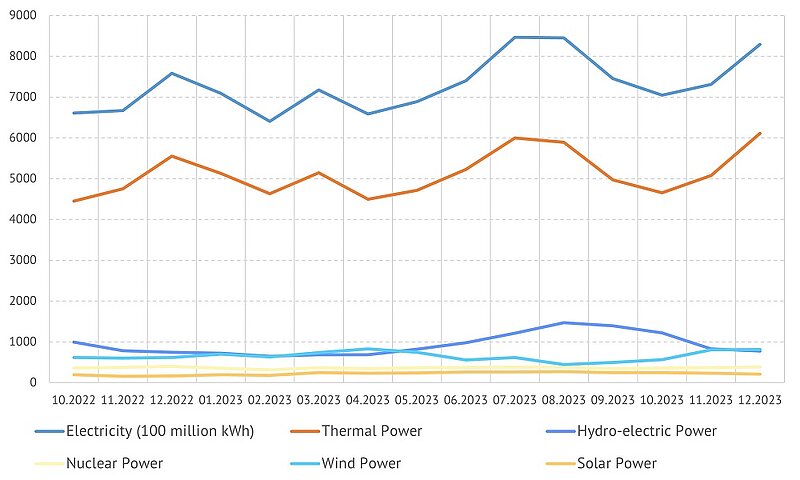
Source: based on National Bureau of Statistics of China
2024年,发电结构发生重大变化。在比较 2023 年第四季度和 2022 年第四季度的数据时,应注意以下事项。风能占比增长0.8%,太阳能占比增长0.5%。
发电来源的份额。左——2022年第四季度,右——2023年第四季度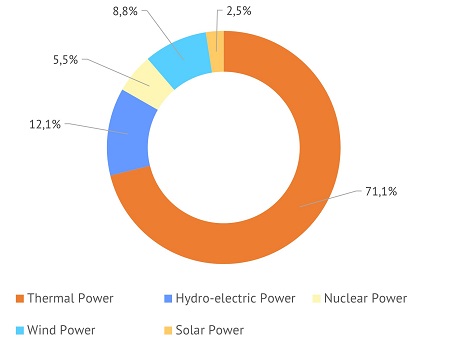

Source: based on National Bureau of Statistics of China
与此同时,化石燃料发电量占比下降1.1%至70.0%。然而,这大约是欧盟国家的两倍,是美国的一倍半。
编委会