
Aenert news. Energy Market & Energy Statistics
Eurostat presented basic data on the state of the economy of the European Union countries for the fourth quarter of 2023. Before analyzing energy indices, which are the most relevant for our topic, it is advisable to look at individual indices of a general economic nature. The industrial production index (is a business cycle indicator that measures monthly changes in the price-adjusted output of industry) best reflects the state of the economy, especially for the most industrially developed countries.
The aggregated IPI of the 27 European Union member countries rose slightly in 2023Q4 after a year of sequential declines. However, the trend of changes in IPI for Germany, Italy and especially the Netherlands, which are among the leaders in industrial production in Europe, looks quite depressing. France and Spain have slightly better IPI scores, however, and they do not show any sustainable growth.
Volume index of production
Source: Based on Eurostat
There is no noticeable change in the trends that have developed over the past year for the index of exports of goods and services. For the majority of the largest economies in Europe, there is a pronounced stabilization of the values of this index, which has continued for the fifth quarter in a row.
Exports of goods and services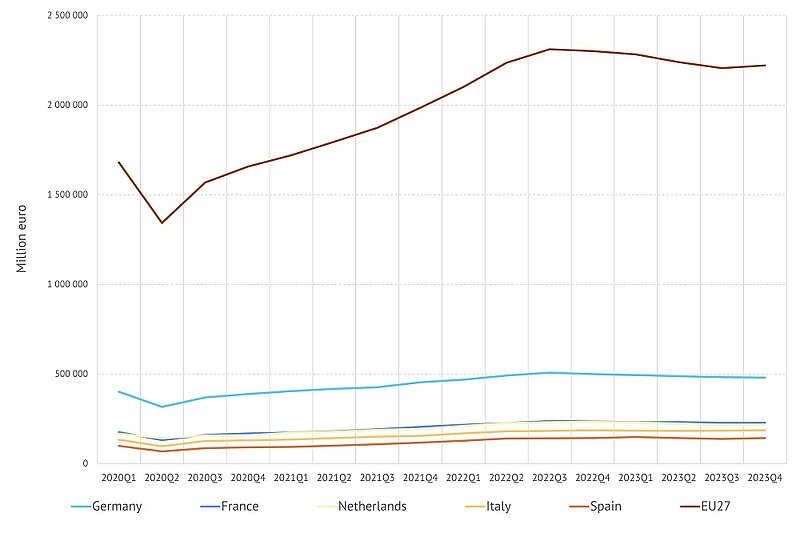
Source: Based on Eurostat
Energy statistics for 2023Q4 are shown in the table below. Among the most significant changes, a serious quarterly increase in natural gas consumption should be highlighted. Compared to the previous quarter, this growth was about 70%, and compared to 2022Q4 - more than 0.5%. Obviously, this growth is seasonal, but there are still timid hopes that this is partly due to the revival of industrial production.
EU energy statistics, natural gas, oil and electricity, 2022 Q4 - 2023 Q4
| Energy Indicator/Q | 2022 Q4 | 2023 Q1 | 2023 Q2 | 2023 Q3 | 2023 Q4 |
|---|---|---|---|---|---|
| Production of natural gas, TJ | 399867,0 | 391095,9 | 327990,5 | 317595,0 | 298695,8 |
| Total consumption of natural gas, TJ | 3666085,8 | 4361503,6 | 2509349,6 | 2160241,7 | 3690923,3 |
| Imports of natural gas, TJ | 5230047,1 | 4661838,6 | 4874738,8 | 4289148,0 | 4440053,6 |
| Imports of crude oil - 1000t* | 120365,4 | 115482,2 | 114811,4 | 122503,0 | 117275,3 |
| Production of electricity - GWh | 657128,9 | 700035,7 | 598157,0 | 600956,5 | 674864,0 |
| Consumption of electricity - GWh | 607804,8 | 643041,0 | 558213,4 | 569138,3 | 620369,9 |
| Imports of electricity - GWh | 109761,0 | 104254,6 | 93238,3 | 100796,9 | 106049,9 |
*Import of crude oil for Italy for December 2023 are taken equal to those for November
Source: Based on Eurostat
Natural gas imports were slightly higher than in the summer third quarter of 2023, but significantly lower than in previous quarters. Compared to last year's fourth quarter, the decline was 15%.
Monthly EU natural gas production and consumption, gas and oil import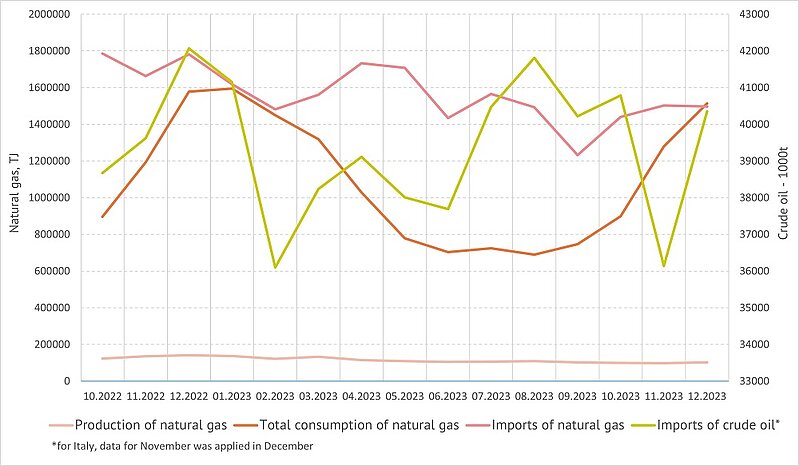
Source: Based on Eurostat
The curve of changes in total electricity generation in the EU countries in 2023Q4 approximately repeats last year’s figures. Wind power and hydropower showed good growth. Although this occurred against a backdrop of increased fossil fuel consumption for power generation compared to the previous two quarters, this was clearly the expected seasonality.
Monthly electricity generation in the EU by source type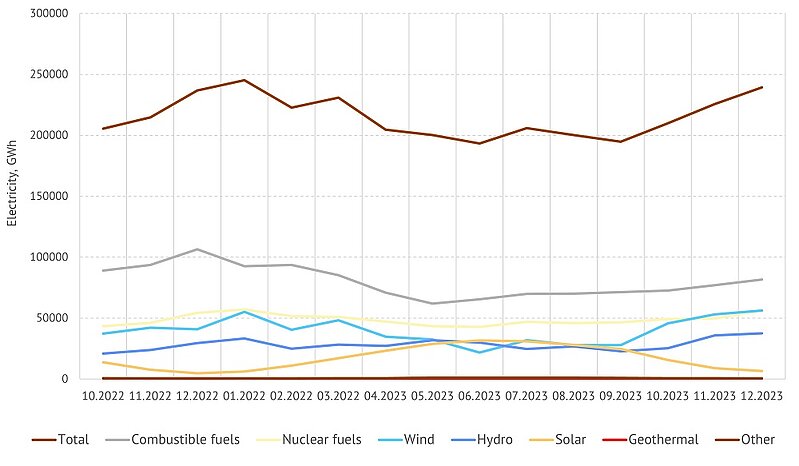
Source: Based on Eurostat
If we compare the structure of electricity generation in the EU between data for 2022 Q4 and 2023 Q4, very significant changes have occurred here. Firstly, noteworthy is the colossal decrease in the share of combustible fuels - by almost 10%. Against this background, the growth in the share of wind energy was 4.7%, hydropower – 3.3%, solar energy – 0.6%. Thus, the impact of renewable energy on electricity generation in the EU is becoming avalanche-like.
Percentage of electric power generation by source type in 2022 Q4 and 2023 Q4

Source: Based on Eurostat
By the Editorial Board