The latest energy report from U.S. Energy Information Administration (EIA) provides a comprehensive view of how the U.S. energy system has developed from 1949 till January 2022. The paper records annual and monthly data sets on energy resources, including production and consumption by sector, trading rates and emissions indicators. Below we present a brief overview of the major changes over the last three years (2019-2021) for U.S. primary energy production and consumption, electricity, and renewable energy.
If we look at the overall primary energy development for the years 2019-2021, we see a clear impact of the pandemic, both at the production and consumption levels. In 2019 the total amount of energy produced was a record 101.437 quadrillion BTU, in 2020 it went down again to 95.672, reaching 97.784 quadrillion BTU in 2021. Of all the energy produced, nearly 80% comes from fossil fuels, 8% from nuclear power, and over 12% from renewable energy sources, a proportion that has not changed significantly in recent years, although there is a slight trend in favour of renewable sources.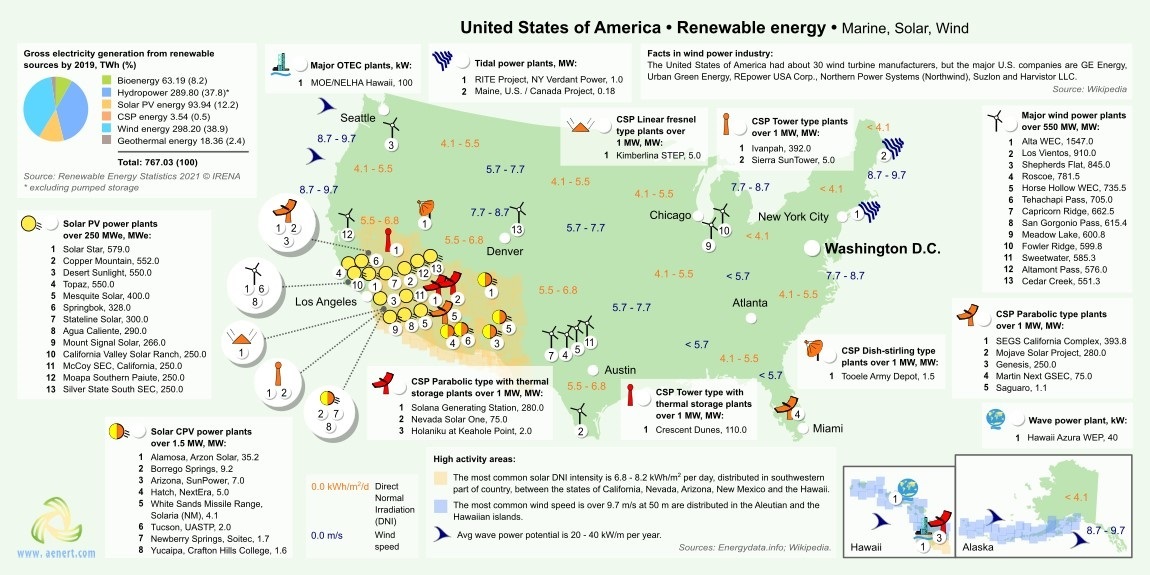
The development of renewable energy can be seen in the figures for energy consumption, which generally reflect the picture in energy production as well. The consumption of biomass, hydro and geothermal energy has not changed particularly over the past 10 years, showing stable figures. In contrast, there has been a marked increase in the consumption of solar and wind energy. While 1,340 trillion BTUs of wind energy were consumed in 2012, this figure rose to 2,635 in 2019 and 3,332 in 2021. The increase in solar energy consumption is even more significant, from 162 trillion BTUs in 2012 to 1,017 in 2019, and 1,501 in 2021. Total U.S. renewable energy consumption in 2019 was 11,473 trillion BTUs, slightly less than the domestic production of 11,632. In 2021, the consumption figure rose to 12.157 trillion BTUs, while 12,320 were produced domestically.
Ivanpah Solar Power Facility, 392 MW
In the period from 2019 to 2021, the indicators of net electricity generation and use remained virtually unchanged, however, the same applies to the last ten years. In 2021, U.S. net utility-scale generation of electricity was about 4,116 billion kilowatt hours (kWh): about 61% was produced from fossil fuels (22% – coal, 38% – natural gas, and 1% – petroleum and other), 20% from renewable energy sources and 19% was from nuclear energy. The U.S. consumes virtually all of its domestically produced energy, and over the past ten years this figure has fluctuated between 3,856 and 4,003 billion kWh.
Energy News Monitoring
Annual Energy Review USA: 20% of U.S. electricity is renewable