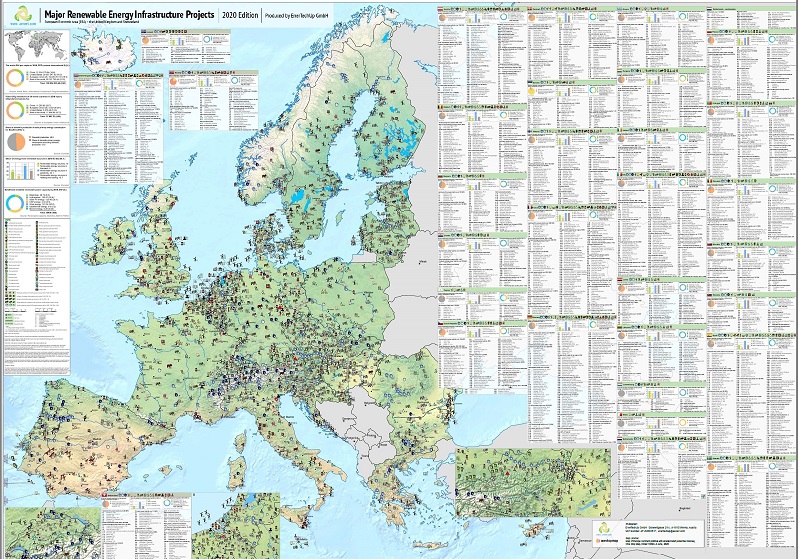
Eurostat provided an Overview of energy statistics in the European Union (EU) in 2020, presenting trends in major energy commodities for primary energy production, imports and exports, gross energy available and final energy consumption.
Overall, the published statistics show that in 2020, gross available energy in the European Union declined by 8.1% compared to 2019. In the figure below, the gross available energy by fuel in the period between 1990 and 2020 is presented. Despite a long-term downward trend, oil and petroleum products remained the most important source of energy for the European economy, while natural gas remained the second major energy source. In 2020, both oil and natural gas were down 12.6% and 2.4%, respectively. As previously predicted, the share of renewable energy continued to grow, overtaking solid fossil fuels back in 2018 and now strengthening its position even further. The share of solid fossil fuels declined by 18.4% in 2020, dropping to its lowest value since 1990.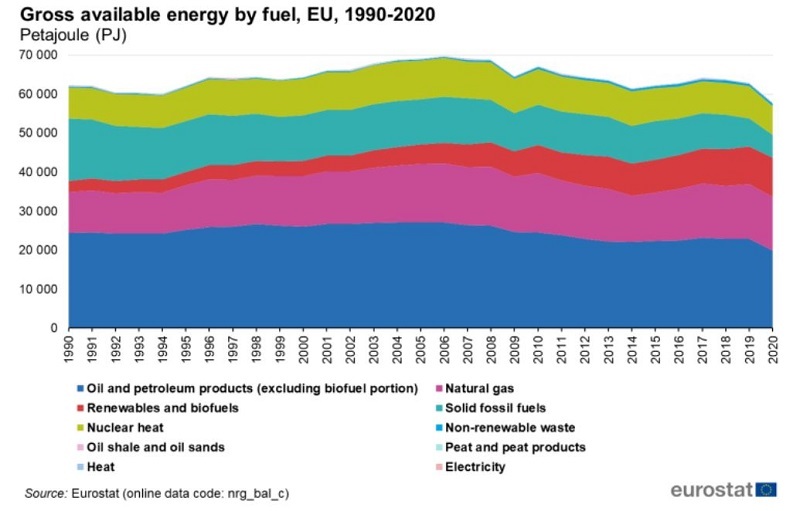
Here is the main statistical information of the report in numbers:
- Primary energy production in the EU in 2020 was 24,027 petajoules (PJ). This is 7.1% less than in 2019: solid fossil fuels declined by 16.5%, natural gas – by 21.2%, oil and petroleum products by 5.2%, nuclear heat by 10.7%. By contrast, growth was recorded for renewable energy (+3.0%) and non-renewable waste (+1.6%). Analysis of the final share in primary energy production in the EU in 2020 reveals that renewables accounted for the largest part (40.8%), followed by nuclear heat (30.5%), solid fossil fuels (14.6%), natural gas (7.2%), oil and oil products (3.7%) and non-renewable waste (2.4%).
- Imports and exports. Imports of primary energy and energy products in the EU far exceeded exports. Crude oil ranked first in energy imports with 18,675 PJ in 2020 (down 13% from 2019), followed by natural gas with 3,786 PJ (down 8.6% from 2019). Data on imports demonstrate the growing dependence of the European Union on non-member countries. Thus, 97% of oil and petroleum products were imported, 84% of natural gas, and 35.8% of solid fossil fuels. In 2020, gasoil and diesel accounted for the largest export goods (3,775 PJ), followed by motor gasoline (2,739 PJ) and natural gas (2,336 PJ).
- Final energy consumption is the total energy consumed by end users, such as households, industry and agriculture. Oil and petroleum products held the biggest share in the structure of final energy consumption in 2020 (35%), ahead of electricity (23.2%), natural gas (21.9 %), renewables (11.8%) solid fossil fuels (2.1%). As the figure below shows, transportation, households, and industry dominated energy use in the EU in 2020.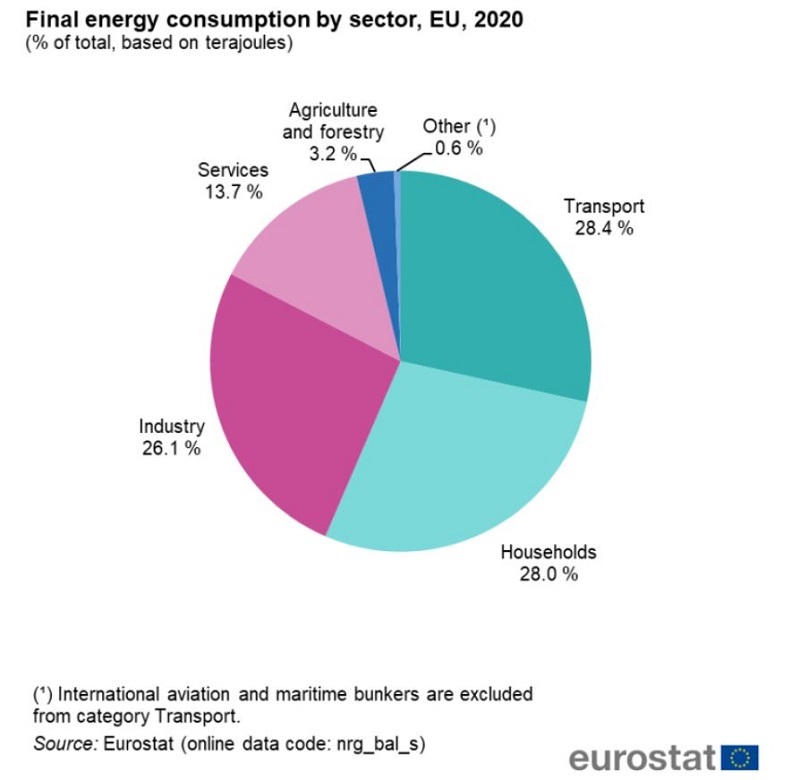
Energy News Monitoring
Energy statistics in the EU: 97% of oil and 84% of natural gas in the EU was imported