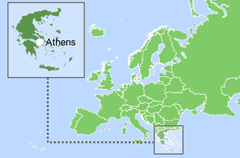

希腊,正式名称为希腊共和国,是巴尔干半岛最南端的国家。 希腊北部与保加利亚和北马其顿共和国接壤,西北部与阿尔巴尼亚接壤,东北部与土耳其接壤。 该国西临爱奥尼亚海,南临地中海,东临爱琴海。 希腊岛屿众多,拥有地中海盆地最长的海岸线,长达13,676公里。
根据2023年的统计数据,希腊面积居世界第97位,人口约1050万。 就人口密度而言,该国在 199 个国家中排名世界第 110 位。 全国行政地图分为13个地区和1个自治修道院国家,首都为雅典,也是人口最多的城市。 政府的政治形式是议会共和制,官方语言是希腊语[1,2,3]。
| Greece / Hellenic Republic | ||
|---|---|---|
| Capital: Athens | Density: 79.1/km2 | Currency: Euro (€) (EUR) |
| Official languages: Greek | Life expectancy at birth: 81.09 years | GDP (PPP): $416.969 billion (2023 est.) |
| National Day: 25 March | Area (land): 131,957 km2 | GDP - per capita (PPP): $39,864 (2023 est.) |
| Population: 10,495,595 (2023 est.) | Coastline: 13,676 km | Internet country code: .gr |
Source: [1,2,3,4,5]

Acropolis in Athens, Greece. Envato. UQPMXSNWDR
希腊相对于其他国家的排名是根据一系列广泛的经济、能源、创新和教育指数以及反映环境状况的指标确定的。 经济指标包括人均GDP、年均GDP增长率、高新技术出口等。 能源指数列表包括石油、天然气和煤炭的探明储量、产耗比以及能源使用情况等。每个指数都有一个包含的成员国排名列表。 由于每个指数的每个评级的国家数量不同,因此将感兴趣的国家的定位显示在一个特殊的图表上,其中纵轴是从0到1的统一相对刻度,而横轴表示各个指数 以及与下面给出的描述相关的相应编号。
因此,在这样一个相对的“0-1”图中,该国家的位置按照其在原始评级列表中的位置成比例地用点来标记。 如果该国在所选指标方面处于领先地位,则将在相关图表“0-1”的上部绿色区域中标记为接近 1,如果该国在评级列表中属于局外人,则将标记为接近 1 图表下方的红色区域为“0-1”等。所有国家均使用单一指数列表。 如果某个国家/地区不在任何指数的排名列表中,则不会显示图表上的相应位置。
希腊经济指数排名:
| Sources: 1. GDP (purchasing power parity), 2020 est. / The World Factbook/Library/Central Intelligence Agency *228 2. GDP - per capita (PPP), 2020 / The World Factbook/Library/Central Intelligence Agency *229 3. Inflation rate (consumer prices), 2019 est. / The World Factbook/Library/Central Intelligence Agency *228 4. Charges for the use of intellectual property, receipts (BoP, current US$), 2020 / International Monetary Fund, Balance of Payments Statistics Yearbook, and data files. / License: CC BY-4.0 *88 5. The Global Competitiveness Index 2019 / Rankings / Reports / World Economic Forum *141 6. High-technology exports (current US$) 2019-2020 / United Nations, Comtrade database through the WITS platform / License: CCBY-4.0 / Data *134 7. 2021 Index of Economic Freedom / International Economies / The Heritage Foundation *178 8. Reserves of foreign exchange and gold, 2017 est. / The World Factbook / Library / Central Intelligence Agency *195 9. Annual average GDP growth in %, for the last 10 years (2011-2020) / World Bank national accounts data, and OECD National Accounts data files / License: CC BY-4.0*206 10. Public debt (% of GDP), 2017 est. / The World Factbook / Library / Central Intelligence Agency (from smallest to largest) *210 * Total number of countries participating in ranking 图 1. 希腊经济指数 |
从上图可以看出,希腊的经济形势相当不平衡。 在所提供的指数中,该国的通货膨胀率(0.88)、GDP(0.76)和人均GDP(0.70)值最高。 希腊经济指标中最薄弱的部分是年平均 GDP 增长率 (0.02) 和公共债务 (0.00)。
希腊国内天然气和石油化石燃料储量非常少,分别占世界总量的0.0005%和0.0006%。 煤炭的情况稍好一些,但储量明显低于世界领先国家。 希腊的煤炭储量占世界的 0.27%,比印度少 38 倍,比哈萨克斯坦少 8 倍。
以吨油当量计算,根据2024年数据,按燃料类型划分的常规探明储量为:99.9%为煤炭,0.1%为天然气(图5)。
表1. 希腊化石能源资源
| Resource /Explanations | Crude oil* | Natural gas* | Coal* | Shale Gas | Tight Oil | Coalmine methane |
|---|---|---|---|---|---|---|
| Value | 0.01 (0.0006%) | 0.035 (0.0005%) | 3 170 (0.27%) | - | - | - |
| Unit | billion barrels | Tcf | million short tons | - | - | - |
| Year | 2021 | 2020 | 2021 | - | - | - |
| Source | [6] | [6] | [6] | - | - | - |
* 括号内提供该国储量占世界总储量的比例
希腊总体上具有发展可再生能源,特别是风电的有利条件。 全国部分地区,特别是东部沿海,50m高度处风速达到8m/s。 希腊南部地区,包括许多岛屿,拥有发展太阳能最有利的气候条件,太阳能GHI达到每天4.9-5.2千瓦时/平方米。
GREECE, PAROS
Latitude: 37.02 Longitude: 25.13
Average speed: 5.05 m/s, Operational share: 78%
Average daily wind speed for 10 years of observations, m/s, 10 m above ground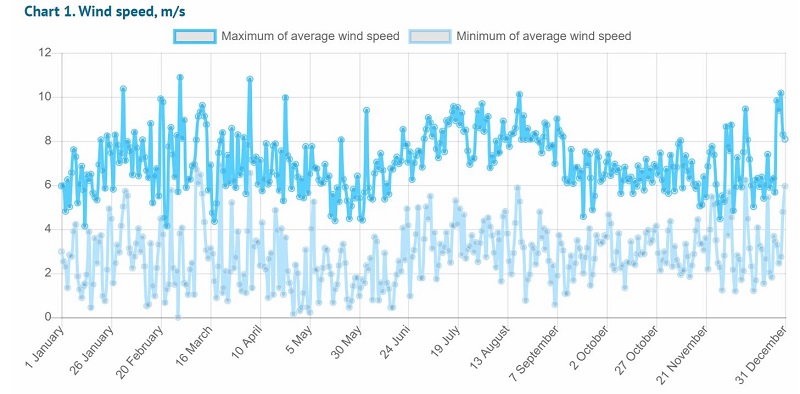
Source: based on NOAA U.S. Department of Commerce
GREECE, MILOS
Latitude: 36.73, Longitude: 24.43
Average daily sky coverage over 10 years of observations, %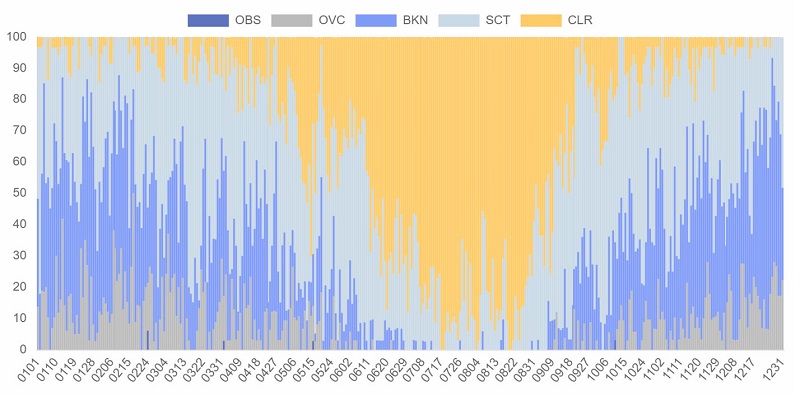
CLR - clear, SCT - scattered from 1/8 TO 4/8, BKN - broken from 5/8 TO 7/8, OVC - overcast, OBS - obscured, POB - partial obscuration
Source: based on NOAA U.S. Department of Commerce
水力发电在该国潜力巨大,在希腊发电中发挥着重要作用,2021年将提供约27%的可再生电力,大部分水力发电厂位于西北部山区。
表2. 希腊的可再生能源资源
| Resource/ explanations | Solar Potential (GHI)* | Wind Potential (50 м)* | Bio Potential (agricultural area) | Bio Potential (forest area) | Geothermal Potenial | Municipal Solid Waste |
|---|---|---|---|---|---|---|
| Value | 4.4-4.9 | 5.0-6.0 | 45.5 | 30.3 | 1500 | 524 |
| Unit | kWh/m2/day | m/s | % of land area | % of land area | MWe | kg per capita |
| Year | 2020 | 2020 | 2020 | 2020 | 2014 | 2021 |
| Source | [7] | [8] | [9] | [10] | [11] | [12] |
*适用于该国大部分领土
该国约75%的领土被农业和林区覆盖。 这些地区的工业废物为开发许多生物能源技术,特别是沼气和生物乙醇生产提供了有价值的资源基础。
根据[6],2022年希腊一次能源总产量为0.154万亿英热单位,而消费量为0.983万亿英热单位。 因此,国内生产占一次能源消费的比重为15.7%。 这使得希腊成为一个高度依赖能源进口的国家。
根据《2022年世界能源统计回顾》,2021年希腊一次能源消耗量为1.05艾焦耳,其中石油占主导地位——49.5%,其次是天然气——23.8%、可再生能源——12.2%、煤炭——6.7%和水力发电 – 4.8% [13]。
Source: U.S. Energy Information Administration (Mar 2024) / www.eia.gov
图 2. 希腊化石燃料的生产和消费(煤炭 - 左,天然气 - 中,石油 - 右)
从上图可以看出,希腊国内化石燃料产量微乎其微,大部分依赖进口。 与2015年相比,2022年天然气消费量将增加一倍多,而同期石油消费量略有下降。 该国唯一几乎完全由国内生产的化石燃料是煤炭,而且消费量呈明显下降趋势。
Sources: U.S. Energy Information Administration (Mar 2024) / www.eia.gov | ||
图 3. 希腊的发电量 |
2022年,希腊总发电量与2015年持平。该国自2014年以来一直面临自发电短缺的问题,并于2021年实现电力自给自足。这主要是由于希腊发电量的增加 可再生能源的能源生产。 相比之下,如果2010年可再生能源(水电除外)占总发电量的比例为5.6%,那么到2022年这一比例将达到约37%。
| Sources: 1. Crude oil proved reserves, 2021 / International Energy Statistic/Geography / U.S. Energy Information Administration (Nov 2021)*98 2. Natural gas proved reserves 2021 / International Energy Statistic / Geography / U.S. Energy Information Administration (Nov 2021) *99 3. Total recoverable coal reserves 2019 / International Energy Statistic / Geography / U.S. Energy Information Administration (Nov 2021) *81 4. Combination production-consumption for Crude oil 2018 / International Energy Statistic / Geography / U.S. Energy Information Administration (Nov 2021) *219 5. Combination production-consumption for Natural gas 2019 / International Energy Statistic / Geography / U.S. Energy Information Administration (Nov 2021) *123 6. Combination production-consumption for Coal 2019 / International Energy Statistic / Geography / U.S. Energy Information Administration (Nov 2021) *128 7. Electricity – from other renewable sources (% of total installed capacity), 2017 est. / The World Factbook / Library / Central Intelligence Agency *170 8. GDP per unit of energy use (PPP per unit of oil equivalent), 2020 *66 Primary energy consumption - BP Statistical Review of World Energy 2021/BP;GDP (purchasing power parity) - The World Factbook/Library/Central Intelligence Agency 9. Energy use (primary energy use of oil equivalent per capita) 2020 *127 Primary energy consumption – BP Statistical Review of World Energy 2021; Population - United Nations, Department of Economic and Social Affairs, Population Division (2019). World Population Prospects 2019, custom data acquired via website. Retrieved 15 November 2021*66 10. The Global Energy Architecture Performance Index Report (EAPI) 2017 / Rankings / Reports / World Economic Forum 11. Electric power consumption (kWh per capita), 2016 *217 Electricity Consumption - The World Factbook / Library / Central Intelligence Agency; Population - United Nations, Department of Economic and Social Affairs, Population Division (2019). World Population Prospects 2019, custom data acquired via website. Retrieved 15 November 2021 12. Combination of electricity production-consumption (kWh)/The World Factbook/Library/Central Intelligence Agency *216 * Total number of countries participating in ranking 图 4. 希腊能源指数 |
上图中显示的能源指数表明希腊是一个能源需求较高的国家。 由于该国的能源需求远高于国内产能,天然气(0.22)和原油(0.11)的发电与消费比率相对较低。
由于该国使用的煤炭几乎全部是国产的,煤炭产耗比(0.88)是所有指标中最高的之一。 此外,希腊在可再生能源产量方面也表现良好(0.89),近年来大幅增长。
图 5 显示了希腊化石燃料行业最大基础设施项目分布的领土地图。如前所述,煤炭储量占所有已探明化石燃料储量的 99.9%,原油占 0.1%。
希腊和巴尔干地区最大的煤矿 Ptolemaida-Florina 位于该国北部。 其他重要矿床包括同样位于该国北部的德拉马和埃拉索纳以及南部的特大城市。 作为脱碳进程的一部分,希腊的长期计划是逐步淘汰煤炭,该计划已开始实施,但因俄罗斯入侵乌克兰而进行了调整。 根据政府声明,该国在未来几年将不得不再次增加煤炭产量,以帮助减少对天然气的依赖。
希腊的原油和天然气开采集中在位于爱琴海北部的普里诺-卡瓦拉近海盆地。 原油由三个油田生产:Prinos、Prinos North 和 Epsilon。 希腊的传统石油基础设施包括几个正在运营的炼油厂、石油储存设施和石油码头。
希腊国内天然气产量有限,几乎完全通过进口满足其天然气需求。 希腊有多个天然气管道系统运行,以确保国内天然气供应和向欧洲的天然气输送。 其中之一是跨亚得里亚海管道,从土耳其边境穿过希腊到达意大利南部,是从阿塞拜疆进口到欧洲的天然气的主要来源。
图5 希腊化石燃料行业基础设施
据美国能源信息署数据,2022年,希腊53.4%的电力由化石燃料发电厂发电,主要由天然气驱动。
图 6. 希腊的发电量
尽管该国最大的发电厂是位于马其顿西部的 Agios Dimitrios,容量为 1595 兆瓦,但为燃煤发电厂。
Agios Dimitrios Power Plant in Greece. 1,585 MW, lignite. Envato. BRZ43CQEND
水力发电每年对国家能源生产的贡献平均约为 10%。 水力发电厂位于西北部,大部分山脉分布的地区。 截至2018年,希腊注册了约115座15兆瓦以下的小型水电站,总装机容量为232.0兆瓦。
图 7. 希腊的可再生能源
美国能源信息署提供的数据显示,2022年希腊约38%的电力生产来自可再生能源(不包括水电),其中以风电为主。
然而,可再生能源在近两年取得了突破,根据希腊互联电网的最新数据[14],2022年可再生能源除大型水力发电厂外,超过了所有其他电力来源,仅次于天然气 位列第二。 2023 年前 8 个月(14224 GWh)保持了这一领先地位,比化石燃料和褐煤合计(12753 GWh)高出 1.5 TWh。
希腊最大的风电集群是位于埃维亚岛南端的 Kafireas 风电项目。 第一部分于2019年投产,总装机容量约154.1兆瓦。 其姊妹项目 330MW Kafireas II 风电场由希腊可再生能源开发商 Terna Energy 开发,并已部分投入运营 [15]。
希腊政府正在制定措施,进一步加快该国可再生能源的发展。 根据环境与能源部提出的《国家能源与气候计划》,该国计划到2030年从可再生能源获得61%的能源。除了进一步发展太阳能和风能外,该计划还设想: 利用生物质生产能源和燃料,并开发适当的能源基础设施,从目前传统的生物质用途过渡到更节能和更具成本效益的用途。 应特别关注生物甲烷的使用,将其直接输入天然气管网,以及其在交通运输领域的应用[16]。
| Sources: 1. The Global Innovation Index 2021, Rankings / Knowledge / World Intellectual Property Organization / Cornell University, INSEAD, and WIPO (2021): Energizing the World with Innovation. Ithaca, Fontainebleau, and Geneva *132 2. Patent Grants 2011-2020, resident & abroad / Statistical country profiles / World Intellectual Property Organization *185 3.Patents in Force 2020 / Statistical country profiles / World Intellectual Property Organization *109 4. QS World University Rankings 2022 *97 5. SCImago Country Rankings (1996-2020) / Country rankings / SCImago, (n.d.). SIR-SCImago Journal & Country Rank [Portal]. Retrieved 17 Nov 2021 *240 6. Internet users in 2018 / The World Factbook / Central Intelligence Agency *229 7. Internet users in 2018 (% Population) / The World Factbook / Central Intelligence Agency *229 8. Government expenditure on education, total (% of GDP), 2019 / United Nations Educational, Scientific, and Cultural Organization (UNESCO) Institute for Statistics. License: CCBY-4.0 / Data as of September 2021*177 9. Research and development expenditure (% of GDP), 2018 / UNESCO Institute for Statistics. License: CCBY-4.0 / Data *119 10. Scientific and technical journal articles, 2018 / National Science Foundation, Science and Engineering Indicators. License: CCBY-4.0 / Data *197 * Total number of countries participating in ranking 图 8. 希腊的教育和创新指数 |
大多数描述希腊在教育和创新相关国际排名中的地位的指数都高于平均水平。 希腊在 SCImago 国家排名 (0.86)、科学技术期刊文章 (0.82) 和专利授权 (0.77) 方面排名最高。 该国最低的指标是教育公共支出(0.32)。 这在一定程度上导致了该国在 QS 世界大学排名中没有超过世界平均水平(0.49)。
| Sources: 1. CO2 total emission by countries 2020 / European Commission / Joint Research Centre (JRC) / Emission Database for Global Atmospheric Research (EDGAR)*208 2. CO2 per capita emission 2020/European Commission/Joint Research Centre (JRC) / Emission Database for Global Atmospheric Research (EDGAR) *208 3. Forest area 2020 (% of land area) / The Global Forest Resources Assessment 2020 / Food and Agriculture Organization of the United Nations *234 4. Forest area change 2010-2020 (1000 ha/year) / The Global Forest Resources Assessment 2020 / Food and Agriculture Organization of the United Nations *234 5. The Environmental Performance Index (EPI) 2020 / Rankings / Yale Center for Environmental Law & Policy / Yale University *180 6. Annual freshwater withdrawals (m3 per capita), 2017 *179 Annual freshwater withdrawals, total (billion m3), 2017 – Food and Agriculture Organization, AQUASTAT data. /License: CC BY-4.0; Population – United Nations, Department of Economic and Social Affairs, Population Division (2019). World Population Prospects 2019, custom data acquired via website. Retrieved 15 November 2021 7. The National Footprint Accounts 2017 (Biocapacity Credit / Deficit) / Global Footprint Network *188 8. Methane emissions (kt of CO2 equivalent), 2018 / Data for up to 1990 are sourced from Carbon Dioxide Information Analysis Center, Environmental Sciences Division, Oak Ridge National Laboratory, Tennessee, United States. Data from 1990 are CAIT data: Climate Watch. 2020. GHG Emissions. Washington, DC: World Resources Institute. Available at: License : Attribution-NonCommercial 4.0 International (CC BY-NC 4.0) *191 9. The Climate Change Performance Index (CCPI) 2022 / Overall Results / Jan Burck, Thea Uhlich, Christoph Bals, Niklas Höhne, Leonardo Nascimento / Germanwatch, NewClimate Institute & Climate Action Network *60 * Total number of countries participating in ranking 图 9. 希腊环境指数 |
希腊是二氧化碳排放总量(0.25)和人均(0.28)较高的国家之一,这在一定程度上解释了其在国家足迹账户(0.22)中排名较低的原因。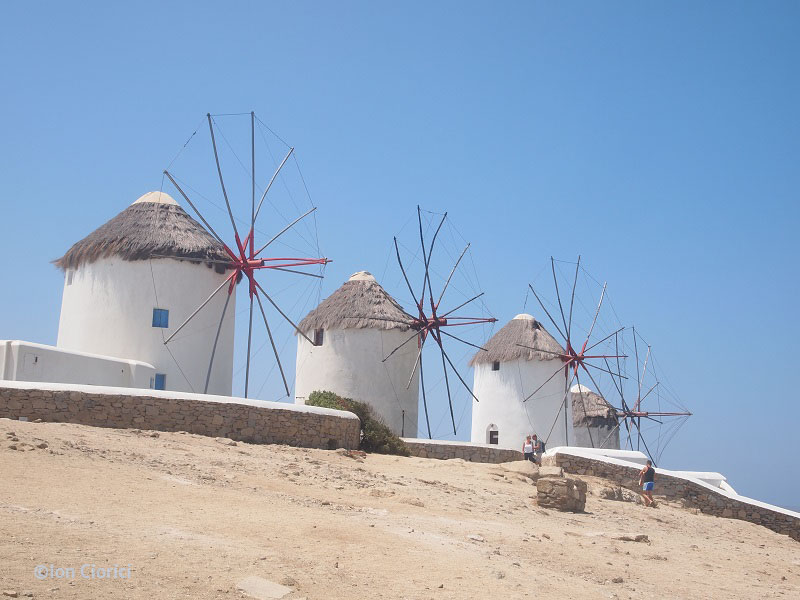
Old windmills. Credit I.Ciorici
另一方面,积极的指标包括该国在年度淡水抽取量(0.91)和环境绩效指数(0.86)方面处于高位。 我国森林面积指标处于世界平均水平(0.50)。 甲烷排放量也是如此(0.49)。 总体来看,从上图可以看出,全国环境状况亟待改善。
[1] List of sovereign states and dependencies by area / Wikipedia / https://en.wikipedia.org/wiki/List_of_countries_and_dependencies_by_area
[2] List of countries and dependencies by population density / Wikipedia / https://en.wikipedia.org/wiki/List_of_countries_and_dependencies_by_population_density
[3] Greece / The world factbook / Library / Central Intelligence Agency / http://www.cia.gov/
[4] GDP, PPP (constant 2011 international $) / World Bank, International Comparison Program database. License: CC BY-4.0 / Data / The World Bank / www.worldbank.org
[5] GDP per capita, PPP (current international $) / World Bank, International Comparison Program database. License: CC BY-4.0 / Data / The World Bank / www.worldbank.org
[6] International Energy Statistic / Geography / U.S. Energy Information Administration (Dec 2022) / https://www.eia.gov/international/
[7] Solar resource data obtained from the Global Solar Atlas, owned by the World Bank Group and provided by Solargis / Global Solar Atlas / https://globalsolaratlas.info
[8] Greece Wind Map / Global Wind Atlas 2.0, a free, web-based application developed, owned and operated by the Technical University of Denmark (DTU) in partnership with the World Bank Group, utilizing data provided by Vortex, with funding provided by the Energy Sector Management Assistance Program (ESMAP). For additional information: https://globalwindatlas.info
[9] Agricultural land (% of land area) /Food and Agriculture Organization, electronic files and web site. License: CC BY-4.0 / Data / The World Bank / www.worldbank.org
[10] Forest area (% of land area) /Food and Agriculture Organization, electronic files and web site. License: CC BY-4.0 / Data / The World Bank / www.worldbank.org
[11] 2016 Annual U.S. & Global Geothermal Power Production Report (PDF) / Geothermal Energy Association / https://www.geo-energy.org/
[12] Municipal waste statistics Updated / Statistics Explained / Eurostat / https://ec.europa.eu/eurostat/statistics-explained/index.php?title=Main_Page
[13] BP Statistical Review of World Energy 2020-2022 (PDF) / BP / www.bp.com
[14] Trends in electricity production – August 2023 / The Green Tank / thegreentank.gr/en/2023/09/26/admie-august2023-en/
[15] Terna Energy / Wind Energy / www.terna-energy.com/activities-en/wind-energy/
[16] National Energy and Climate Plan (PDF) / Ministry of the Environment and Energy / energy.ec.europa.eu/system/files/2020-03/el_final_necp_main_en_0.pdf
图表和曲线的来源在图像下方指定。