
Contents
General State of the Economy
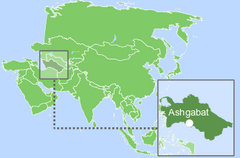
Turkmenistan is a country in Central Asia, bordered by Kazakhstan to the north, Uzbekistan to the north and east, Afghanistan to the southeast and Iran to the south. In the west, the country has access to the Caspian Sea. The total length of the country's coastline is 1,768 km. According to 2022 statistics, Turkmenistan, which in terms of the size of its territory is 55th in the world, is home to around 5,7 million people. In terms of population density, the country is 225th in the world. Turkmenistan is a presidential republic with its capital in Ashgabat [1,2,3].
| Turkmenistan | ||
|---|---|---|
| Capital: Ashgabat | Density: 10.5/km2 | Currency: Manat (TMT) |
| Official languages: Turkmen | Life expectancy at birth: 68.69 years | GDP (PPP): $126.132 billion (2023 est.) |
| National Day: 27 September | Area (land): 491,210 km2 | GDP - per capita (PPP): $19,938 (2023 est.) |
| Population: 5,636,011 (2022 est.) | Coastline: 1768 km | Internet country code: .tm |
Source: [1,2,3,4,5]

General Views to the president palace. Ashkhabad. Turkmenistan / iStock 2092085002
The ranking positions of Turkmenistan relative to other countries have been determined for an extensive list of economic, energy, innovative and educational indices, as well as for metrics reflecting the state of the environment. The economic indices include, for example, GDP per capita, annual average GDP growth, high-technology exports, and others. The list of energy indices includes proven reserves of oil, gas and coal, production-consumption ratio combined, and energy use, etc. Each of the indices has a ranked list of included member countries. Since the number of countries in each rating is different for each index, the positioning of the country of interest is displayed on a special chart, where the vertical axis is a uniform relative scale from 0 to 1, whereas the horizontal axis denominates the various indices and respective numbers relating to the descriptions given underneath.
Thus, in such a relative “0-1” diagram, the country’s position is marked with a dot in proportion to its location in the original rating list. If the country is among the leaders regarding the selected indicator, it will be marked close to 1 in the upper green zone on the relevant chart “0-1”, if the country is an outsider in the rating list, then it will be marked in the lower red zone of the chart “0-1”, etc. A single list of indices is used for all countries. If a country is not in the ranking list for any index, then the corresponding position on the charts is not displayed.
Ranking position of Turkmenistan for list of economic indices:
| Sources: 1. GDP (purchasing power parity), 2020 est. / The World Factbook/Library/Central Intelligence Agency *228 2. GDP - per capita (PPP), 2020 / The World Factbook/Library/Central Intelligence Agency *229 3. Inflation rate (consumer prices), 2019 est. / The World Factbook/Library/Central Intelligence Agency *228 4. Charges for the use of intellectual property, receipts (BoP, current US$), 2020 / International Monetary Fund, Balance of Payments Statistics Yearbook, and data files. / License: CC BY-4.0 *88 5. The Global Competitiveness Index 2019 / Rankings / Reports / World Economic Forum *141 6. High-technology exports (current US$) 2019-2020 / United Nations, Comtrade database through the WITS platform / License: CCBY-4.0 / Data *134 7. 2021 Index of Economic Freedom / International Economies / The Heritage Foundation *178 8. Reserves of foreign exchange and gold, 2017 est. / The World Factbook / Library / Central Intelligence Agency *195 9. Annual average GDP growth in %, for the last 10 years (2011-2020) / World Bank national accounts data, and OECD National Accounts data files / License: CC BY-4.0 *206 10. Public debt (% of GDP), 2017 est. / The World Factbook / Library / Central Intelligence Agency (from smallest to largest) *210 * Total number of countries participating in ranking Figure 1. Economic Indices of Turkmenistan |
The highest indicators for Turkmenistan depicted in the chart above are the Annual average GDP growth (0.99) and Public debt as % of GDP (0.79). In addition, Reserves of foreign exchange and gold are relatively high (0.71). GDP (0.58) and GDP per capita (0.54) are slightly above the world average. Data concerning the Use of intellectual property and High-technology exports is unavailable and Turkmenistan is not included in the Global Competitiveness Index. The weakest spots in Turkmen economic indicators are Inflation rate (0.12) and the Index of Economic Freedom (0.06).
Energy Resources
Turkmenistan has significant proven reserves of fossil fuels. The country has some of the world's largest natural gas deposits, making Turkmenistan one of the global leaders in natural gas reserves, with a share of 5.51% of the world's total. The share of crude oil is 0.035% of the world’s total [6].
In terms of tons of oil equivalent, according to 2022 data, conventional proved reserves by fuel type were: 90.2% – gas, and 0.8% – oil (Fig.5).
Table 1. Fossil energy resources of Turkmenistan
| Resource /Explanations | Crude oil* | Natural gas* | Coal | Tight Oil | Shale Gas |
|---|---|---|---|---|---|
| Value | 0.6 (0.035%) | 400 (5.51%) | - | - | - |
| Unit | billion barrels | Tcf | - | - | - |
| Year | 2021 | 2020 | - | - | - |
| Source | [6] | [6] | [-] | [-] | [-] |
* share of the country’s reserves in world total is provided in brackets
Although Turkmenistan has a high potential for renewable energy sources, facilitated by climatic and geographical conditions, the country has virtually no market for renewable energy and the sector is just beginning to develop.
Western Turkmenistan along the coastline with the Caspian Sea and the Garabogaz Bay, in the Balkan region has very favorable conditions for the development of wind energy, where wind speeds reach more than 7.5 m/s at a height of 50 m. With more than 300 sunny days per year and an average solar GHI of 4.6 to 5.1, Turkmenistan also has enormous potential for harnessing solar energy.
Table 2. Renewable energy resources of Turkmenistan
| Resource/ Explanations | Solar Potential (DNI)* | Wind Potential (50 м)* | Bio Potential (agricultural area) | Bio Potential (forest area) | Municipal Solid Waste |
|---|---|---|---|---|---|
| Value | 4.6 -5.1 | 6.0-7.5 | 72.0 | 8.8 | 0.27 |
| Unit | kWh/m2/day | m/s | % of land area | % of land area | kg/per capita/day |
| Year | 2020 | 2020 | 2020 | 2020 | 2018 |
| Source | [7] | [8] | [9] | [10] | [11] |
*for the majority of the territory of the country
As for other types of renewable energy, such as bioenergy, hydropower, and geothermal energy, there is relatively low potential in Turkmenistan.
Energy Balance
According to [6], in 2022 in Turkmenistan, the total production of primary energy was 3.678 quadrillion Btu, while consumption was at the level of 1.818 quadrillion Btu. Thus, the share of domestic consumption in primary energy production was 49.4%. This makes Turkmenistan a country independent of energy imports (without taking into account the structure of energy consumption).
According to the Statistical Review of World Energy 2022, primary energy consumption in Turkmenistan in 2021 amounted to 1.60 exajoules and was dominated by natural gas – 82.5%, ahead of oil – 17.5% [12].
Source: U.S. Energy Information Administration (Mar 2024) / www.eia.gov
Figure 2. The Production and Consumption of fossil fuels in Turkmenistan (left — coal, in the center — gas, right — oil)
As can be seen from the diagram above, natural gas output in Turkmenistan has gradually increased over the past ten years, and production is almost twice as high as domestic consumption. The country also produces about a third more oil than it consumes.
Sources: U.S. Energy Information Administration (Mar 2024) / www.eia.gov | ||
| Figure 3. Electricity Generation in Turkmenistan |
Over the past ten years, total electricity production in Turkmenistan has increased by more than 35%. In 2021, virtually 100% of electricity was generated by fossil fuel-fired power plants, fueled almost entirely by natural gas. The country has a number of small-scale photovoltaic power plants, but they do not contribute to the overall balance of electricity production. The amount of hydroelectric power that is generated in Turkmenistan is also insignificant.
The volume of electricity generation in Turkmenistan exceeds the volume of consumption, allowing the country to export the remaining production. However, it should be taken into account that due to the bad shape of power infrastructure, the distribution system suffers from severe power losses that exceed 2.892 billion kWh per year [3].
| Sources: 1. Crude oil proved reserves, 2021 / International Energy Statistic/Geography / U.S. Energy Information Administration (Nov 2021)*98 2. Natural gas proved reserves 2021 / International Energy Statistic / Geography / U.S. Energy Information Administration (Nov 2021) *99 3. Total recoverable coal reserves 2019 / International Energy Statistic / Geography / U.S. Energy Information Administration (Nov 2021) *81 4. Combination production-consumption for Crude oil 2018 / International Energy Statistic / Geography / U.S. Energy Information Administration (Nov 2021) *219 5. Combination production-consumption for Natural gas 2019 / International Energy Statistic / Geography / U.S. Energy Information Administration (Nov 2021) *123 6. Combination production-consumption for Coal 2019 / International Energy Statistic / Geography / U.S. Energy Information Administration (Nov 2021) *128 7. Electricity – from other renewable sources (% of total installed capacity), 2017 est. / The World Factbook / Library / Central Intelligence Agency *170 8. GDP per unit of energy use (PPP per unit of oil equivalent), 2020 *66 Primary energy consumption - BP Statistical Review of World Energy 2021/BP;GDP (purchasing power parity) - The World Factbook/Library/Central Intelligence Agency 9. Energy use (primary energy use of oil equivalent per capita) 2020 *127 Primary energy consumption – BP Statistical Review of World Energy 2021; Population - United Nations, Department of Economic and Social Affairs, Population Division (2019). World Population Prospects 2019, custom data acquired via website. Retrieved 15 November 2021*66 10. The Global Energy Architecture Performance Index Report (EAPI) 2017 / Rankings / Reports / World Economic Forum 11. Electric power consumption (kWh per capita), 2016 *217 Electricity Consumption - The World Factbook / Library / Central Intelligence Agency; Population - United Nations, Department of Economic and Social Affairs, Population Division (2019). World Population Prospects 2019, custom data acquired via website. Retrieved 15 November 2021 12. Combination of electricity production-consumption (kWh)/The World Factbook/Library/Central Intelligence Agency *216 * Total number of countries participating in ranking Figure 4. Energy indices of Turkmenistan |
Turkmenistan is one of the world's leading countries in terms of fossil fuel reserves, as the energy indices presented in the chart above clearly demonstrate. The highest indicators of the country are Natural gas proved reserves (0.95) as well as Production-consumption combination for natural gas (0.93) and for crude oil (0.88). The oil reserve values in the global comparison are somewhat lower (0.55). The reserves of coal in Turkmenistan are not significant, so positions in the chart concerning coal are blank. This also applies to the Electricity from other renewable sources indicator. According to the primary statistics, Turkmenistan has a relatively good electricity generation to consumption ratio (0.77) and high ratio of Primary energy use per capita (0.83). Turkmenistan is included in the Global Energy Architecture Performance Index report, but its performance is very low compared to other countries (0.08).
Energy Infrastructure
Natural gas plays a dominant role in Turkmenistan’s energy system. The country has several of the world's largest natural gas fields, located mainly in the Amu Darya basin in the southeast, the Murghab basin in the south and the South Caspian basin in the western part of the country. The Galkynysh natural gas field in Mary Province is considered the second largest gas field in the world. Two new fields – Garakel and Bagli – were discovered near the Galkynysh field in 2015. The recoverable resources of these natural gas fields are estimated at 42 Tcf [6].
Turkmen conventional natural gas infrastructure includes several gas processing plants and compressor stations. Furthermore, the country has one gas-to-liquids plant in the town of Ovadan-Depe, located near the capital city. Ashgabat is located quite far from oil refineries. Therefore, given the large scale of the country, a decision was made to build a plant to process natural gas into liquid fuel. The plant is capable of processing 1.785 billion m3/year of gas and producing up to 15,500 barrels per day of Euro-5 gasoline, as well as a number of other products. The plant was built under the Haldor Torsoe project (TIGAS™ solution) at a cost of $1.7 billion and commissioned in June 2019 [13].
Turkmenistan has about 7,500 km of gas pipelines, allowing gas imports to China, Russia and Iran. The TAPI pipeline, which will transport natural gas from the Galkynysh gas field through Afghanistan to Pakistan and on to India, is currently under construction at a rapid pace. This year, agreements were reached to build the fourth string of the gas pipeline to China and ensure gas supplies at the level of 65 billion m3/year. In addition, Turkmenistan is working on a gas pipeline to export natural gas to Europe.
Most of Turkmenistan’s oilfields are onshore and situated in the South Caspian Basin and the Garashyzlyk onshore area in the west of the country. There are two oil refineries in Turkmenistan, Turkmenbashy and Seydi with a total crude oil processing capacity of 236 000 bpd.

Figure 5. Basic infrastructural facilities of the fossil fuel sector in Turkmenistan

Figure 6. Electricity production and Renewable energy in Turkmenistan
As already mentioned, Turkmenistan has very favorable conditions for the development of wind and solar energy. The Government of the country aims to develop renewable energy projects and diversify the country's energy balance, promoting environmental protection and rational use of natural resources. One of the planned projects involves active construction of solar power plants with a capacity of more than 6 MW in remote and sparsely populated areas of Turkmenistan [15].
Turkmenistan is making efforts to achieve climate neutrality. The government has adopted a National Strategy on Climate Change and a National Strategy for the Development of Renewable Energy until 2030. In addition to the government's focus on the development of wind and solar energy projects, equally important is the high content of silicon, a semiconductor material, in the sands of the Karakum Desert, which could allow the country to gain an important position in the production of solar photovoltaic panels and the development of solar PV energy [16].
The State Energy Saving Program for 2018-2024 also calls for increasing the role of renewable energy sources. It is planned to launch biogas plants for solid waste processing, install industrial wind turbines at optimal sites for their operation and modernizing the existing grid infrastructure [17].
Education and Innovation
The following chart shows Turkmenistan's positions in terms of education and innovation:
Sources: 1. The Global Innovation Index 2021, Rankings / Knowledge / World Intellectual Property Organization / Cornell University, INSEAD, and WIPO (2021): Energizing the World with Innovation. Ithaca, Fontainebleau, and Geneva *132 2. Patent Grants 2011-2020, resident & abroad / Statistical country profiles / World Intellectual Property Organization *185 3.Patents in Force 2020 / Statistical country profiles / World Intellectual Property Organization *109 4. QS World University Rankings 2022 *97 5. SCImago Country Rankings (1996-2020) / Country rankings / SCImago, (n.d.). SIR-SCImago Journal & Country Rank [Portal]. Retrieved 17 Nov 2021 *240 6. Internet users in 2018 / The World Factbook / Central Intelligence Agency *229 7. Internet users in 2018 (% Population) / The World Factbook / Central Intelligence Agency *229 8. Government expenditure on education, total (% of GDP), 2019 / United Nations Educational, Scientific, and Cultural Organization (UNESCO) Institute for Statistics. License: CCBY-4.0 / Data as of September 2021*177 9. Research and development expenditure (% of GDP), 2018 / UNESCO Institute for Statistics. License: CCBY-4.0 / Data *119 10. Scientific and technical journal articles, 2018 / National Science Foundation, Science and Engineering Indicators. License: CCBY-4.0 / Data *197 * Total number of countries participating in ranking | ||
| Figure 7. The indices of education and innovation in Turkmenistan |
All indicators describing Turkmenistan's position on various international ranking lists related to education and innovation are well below the global average. The country's lowest positions are in the Scientific and technical journal articles (0.05), Internet users in relation to country’s population (0.15) and SCImago Country Rankings (0.20). In addition, Turkmenistan is not included in the Global Innovation Index 2021, and there is no information on patents issued, patents in force, or research and development expenditures, so four positions in the chart above appear blank.
Ecology and Environment Protection
Indicators related to environmental issues are presented in the following diagram:
| Sources: 1. CO2 total emission by countries 2020 / European Commission / Joint Research Centre (JRC) / Emission Database for Global Atmospheric Research (EDGAR)*208 2. CO2 per capita emission 2020/European Commission/Joint Research Centre (JRC) / Emission Database for Global Atmospheric Research (EDGAR) *208 3. Forest area 2020 (% of land area) / The Global Forest Resources Assessment 2020 / Food and Agriculture Organization of the United Nations *234 4. Forest area change 2010-2020 (1000 ha/year) / The Global Forest Resources Assessment 2020 / Food and Agriculture Organization of the United Nations *234 5. The Environmental Performance Index (EPI) 2020 / Rankings / Yale Center for Environmental Law & Policy / Yale University *180 6. Annual freshwater withdrawals (m3 per capita), 2017 *179 Annual freshwater withdrawals, total (billion m3), 2017 – Food and Agriculture Organization, AQUASTAT data. /License: CC BY-4.0; Population – United Nations, Department of Economic and Social Affairs, Population Division (2019). World Population Prospects 2019, custom data acquired via website. Retrieved 15 November 2021 7. The National Footprint Accounts 2017 (Biocapacity Credit / Deficit) / Global Footprint Network *188 8. Methane emissions (kt of CO2 equivalent), 2018 / Data for up to 1990 are sourced from Carbon Dioxide Information Analysis Center, Environmental Sciences Division, Oak Ridge National Laboratory, Tennessee, United States. Data from 1990 are CAIT data: Climate Watch. 2020. GHG Emissions. Washington, DC: World Resources Institute. Available at: License : Attribution-NonCommercial 4.0 International (CC BY-NC 4.0) *191 9. The Climate Change Performance Index (CCPI) 2022 / Overall Results / Jan Burck, Thea Uhlich, Christoph Bals, Niklas Höhne, Leonardo Nascimento / Germanwatch, NewClimate Institute & Climate Action Network *60 * Total number of countries participating in ranking | ||
| Figure 8. Environmental Indices of Turkmenistan |
Turkmenistan belongs to the group of countries with the large amount of carbon dioxide (0.22) and methane emissions (0.17). Per capita emissions are even worse (0.08), contributing significantly to the country's low ranking in the National Footprint Accounts (0.20). In Turkmenistan, as can be seen from the diagram, the area of forests is small (0.22), but their number at least remains stable in recent years, showing no tendency to their decrease (0.51). The country is not included in the Climate Change Performance Index (CCPI) 2022, so this position in the chart remains unfilled. Among the country's positive environmental characteristics is its annual freshwater withdrawal (0.99), which is very high, compared to other countries. In general, the environmental situation in Turkmenistan requires significant improvement.
References
[1] List of sovereign states and dependencies by area / Wikipedia / en.wikipedia.org/wiki/List_of_sovereign_states_and_dependencies_by_area
[2] List of countries and dependencies by population density / Wikipedia / en.wikipedia.org/wiki/List_of_countries_and_dependencies_by_population_density
[3] Turkmenistan / The world factbook / Library / Central Intelligence Agency / www.cia.gov
[4] GDP, PPP (constant 2011 international $) / World Bank, International Comparison Program database. License: CC BY-4.0 / Data / The World Bank / www.worldbank.org
[5] GDP per capita, PPP (current international $) / World Bank, International Comparison Program database. License: CC BY-4.0 / Data / The World Bank / www.worldbank.org
[6] International Energy Statistic / Geography / U.S. Energy Information Administration (Dec 2022) / www.eia.gov/beta/international/
[7] Solar resource data obtained from the Global Solar Atlas, owned by the World Bank Group and provided by Solargis / Global Solar Atlas / globalsolaratlas.info
[8] Wind Map / Global Wind Atlas 2.0, a free, web-based application developed, owned and operated by the Technical University of Denmark (DTU) in partnership with the World Bank Group, utilizing data provided by Vortex, with funding provided by the Energy Sector Management Assistance Program (ESMAP). For additional information: globalwindatlas.info
[9] Agricultural land (% of land area) /Food and Agriculture Organization, electronic files and web site. License: CC BY-4.0 / Data / The World Bank / www.worldbank.org
[10] Forest area (% of land area) /Food and Agriculture Organization, electronic files and web site. License: CC BY-4.0 / Data / The World Bank / www.worldbank.org
[11] What a Waste 2.0 (PDF) / Resources / The World Bank / http://www.worldbank.org/
[12] BP Statistical Review of World Energy 2020-2022 (PDF) / BP / www.bp.com
[13] World’s only natural gas-to-gasoline plant in operation in Turkmenistan/ Topsoe / https://www.topsoe.com/blog/worlds-only-natural-gas-to-gasoline-plant-in-operation-in-turkmenistan
[14] The current state of the electric power industry in Turkmenistan / 05.09.2022 / https://www.newscentralasia.net/
[15] Potential of Turkmenistan in shaping the clean energy of the future presented in Brussels / 07.07.2023 / TURKMENBASHI OIL PROCESSING COMPLEX / https://tngizt.gov.tm/en
[16] CAREC ENERGY OUTLOOK 2030 / December 2022 / https://www.adb.org/sites/default/files/publication/850111/carec-energy-outlook-2030.pdf
[17] Nationally Determined Contribution of Turkmenistan under the Paris Agreement / 2022 / https://unfccc.int/sites/default/files/NDC/2023-01/NDC_Turkmenistan_12-05-2022_approv.%20by%20Decree_Eng.pdf
The sources of charts and curves are specified under the images.
For more information about the energy industry in Turkmenistan see here