

Contents
General State of the Economy
Kenya, officially the Republic of Kenya is a country in East Africa bordering Ethiopia and South Sudan to the north, Somalia to the east, and Tanzania to the south. The Indian Ocean washes the shores of the country to the south-east. The total length of the country's coastline is 536 km [3].
| Kenya | ||
|---|---|---|
| Capital: Nairobi | Density: 82/km2 | Currency: Kenyan shilling (KES) |
| Official languages: Swahili, English | Life expectancy at birth: 62.68 years | GDP (PPP): $338.964 billion (2023 est.) |
| National Day: 12 December | Area: 580,367 km2 | GDP - per capita (PPP): $6,676 (2023 est.) |
| Population: 52,428,000 (2024 est.) | Coastline: 536 km | Internet country code: .ke |
Source: [1,2,3,4,5]
According to 2023 statistics, Kenya, which ranks 51st in the world in terms of the size of its territory, is home to around 57 million people. In terms of population density, the country occupies the 126th place in the world. Kenya is a presidential republic divided into 47 counties. The national capital and the country's largest city is Nairobi. Mombasa is the second largest city and the country’s chief port.
The rating positions of Kenya relative to other countries have been determined for an extensive list of economic, energy, innovative and educational indices, as well as for metrics reflecting the state of the environment. The economic indices include, for example, GDP per capita, annual average GDP growth, high-technology exports, and others. The list of energy indices includes proven reserves of oil, gas and coal, production-consumption ratio combined, and energy use, etc. Each of the indices has a ranked list of included member countries. Since the number of countries in each rating is different for each index, the positioning of the country of interest is displayed on a special chart, where the vertical axis is a uniform relative scale from 0 to 1, whereas the horizontal axis denominates the various indices and respective numbers relating to the descriptions given underneath.
Thus, in such a relative “0-1” diagram, the country’s position is marked with a dot in proportion to its location in the original rating list. If the country is among the leaders regarding the selected indicator, it will be marked close to 1 in the upper green zone on the relevant chart “0-1”, if the country is an outsider in the rating list, then it will be marked in the lower red zone of the chart “0-1”, etc.
Ranking position of Kenya for list of economic indices:
| Sources: 1. GDP (purchasing power parity), 2020 est. / The World Factbook/Library/Central Intelligence Agency *228 2. GDP - per capita (PPP), 2020 / The World Factbook/Library/Central Intelligence Agency *229 3. Inflation rate (consumer prices), 2019 est. / The World Factbook/Library/Central Intelligence Agency *228 4. Charges for the use of intellectual property, receipts (BoP, current US$), 2020 / International Monetary Fund, Balance of Payments Statistics Yearbook, and data files. / License: CC BY-4.0 *88 5. The Global Competitiveness Index 2019 / Rankings / Reports / World Economic Forum *141 6. High-technology exports (current US$) 2019-2020 / United Nations, Comtrade database through the WITS platform / License: CCBY-4.0 / Data *134 7. 2021 Index of Economic Freedom / International Economies / The Heritage Foundation *178 8. Reserves of foreign exchange and gold, 2017 est. / The World Factbook / Library / Central Intelligence Agency *195 9. Annual average GDP growth in %, for the last 10 years (2011-2020) / World Bank national accounts data, and OECD National Accounts data files / License: CC BY-4.0 *206 10. Public debt (% of GDP), 2017 est. / The World Factbook / Library / Central Intelligence Agency (from smallest to largest) *210 * Total number of countries participating in ranking Figure 1. Economic Indices of Kenya |
In terms of GDP (0.72) and Annual average GDP growth in %, (0.87), Kenya demonstrates quite high rates compared to other countries of the world. However, GDP per capita is relatively low (0.21). Other indices demonstrating the weak economic position of the country are Inflation rate (0.20), the 2021 Index of Economic Freedom (0.22), and the Global Competitiveness Index 2019 (0.33). Data on the use of intellectual property is not available, so this position on the chart above is blank.
Energy Resources
Kenya has proven reserves of coal, such as in the Mui basin in Kitui County, and oil has been discovered in the Tertiary Rift Basin. For example, there are more than 600 million barrels of recoverable oil resources in the South Lokichar basin [6]. But Kenya's fossil fuel resources are underexploited so the country depends on imports, mostly coal and petroleum products.
Kenya has a fairly high overall renewable energy potential, including geothermal, solar, wind, biomass, and hydropower, but the country is far from making the most of it. If this potential is fully exploited, Kenya can achieve a complete transition to renewable energy sources.
Table 1.Renewable energy resources of Kenya
| Resource/ Explanations | Solar Potential (GHI)* | Wind Potential (50 м)* | Bio Potential (agricultural area) | Bio Potential (forest area) | Geothermal Potenial | Municipal Solid Waste |
|---|---|---|---|---|---|---|
| Value | 5.5-6.5 | 4.0-6.0 | 48.5 | 6.3 | 10 000 | 0.39 |
| Unit | kWh/m2/day | m/s | % of land area | % of land area | MWe | kg/per capita/day |
| Year | 2020 | 2020 | 2020 | 2020 | 2016 | 2018 |
| Source | [8] | [9] | [10] | [11] | [12] | [13] |
*for most of the territory of the country
Geothermal energy and hydropower prevail in terms of installed renewable energy capacities (35.8% and 32.4%, respectively), followed by wind energy (16.5%), solar PV (11.6%) and bioenergy (3.7%). Moreover, hydropower and other renewables play a significant role in Kenya’s power generation, contributing about 92% to all electricity produced in 2022.
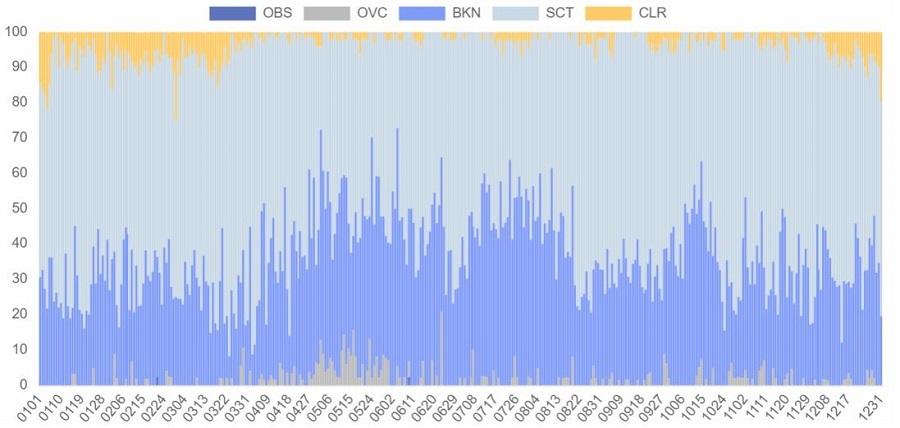
In some places of the northwest area, between Eastern and Rift Valley provinces, the solar GHI intensity reaches 6.5-6.8 kWh/m2 per day. The percentage of solar energy harnessed for commercial and domestic applications is insignificant compared to the available potential.
LAMU MANDA. Country: KENYA. Latitüde: -2.25. Longitude: 40.91
Sky cover, %
Kenya is endowed with favorable wind speeds. In a number of regions of the country, mainly in Eastern province and along the coastline of the Lake Turkana, wind speed reaches 7.5 m/s at a height of 50 m.
MALINDI. Country: KENYA. Latitüde: -3.23. Longitude: 40.1. 10 m
Wind speed, m/s
Considerable agricultural area suggests that there is plenty of feedstock available for the development of bioenergy. According to the Energy and Petroleum Statistics Report 2022, the main sources of biomass in Kenya are charcoal, wood fuel, and agricultural waste. In addition, there is considerable potential for power generation using forestry and agro-industrial waste including bagasse. Biogas potential in Kenya has been identified in municipal waste, sisal and coffee production [14].
Energy Balance
According to [6], in 2022 in Kenya, the total production of primary energy was 0.04 quadrillion Btu, while consumption was at the level of 0.308 quadrillion Btu. Thus, the share of domestic production in primary energy consumption was 12,99%. This makes Kenya a country heavily dependent on energy imports.
Source: U.S. Energy Information Administration (Mar 2024) / www.eia.gov
Figure 2. The production and consumption of fossil fuels in Kenya (coal – left, gas – in the center, oil – right)
Driven by population growth and expansion of the economy, consumption of fossil fuels in Kenya, mostly coal and petroleum products, has generally been increasing over the past 10 years, with the exception of 2020, which saw a slight decline due to the impact of COVID-19.
Sources: U.S. Energy Information Administration (Mar 2024) / www.eia.gov | ||
| Figure 3. Electricity production in Kenya |
Domestic generation fully meets Kenya's electricity needs. Total electricity generation in the country has grown by about 1.5 times over the past ten years. In 2022, approximately 67% of electricity was produced by non-hydro renewable power plants, about 25% – by hydroelectric power plants and only 8% at plants powered by fossil fuels. It should be noted that electricity production from non-hydro renewable sources has almost quadrupled over the past 10 years. Geothermal generation currently accounts for the majority of electricity generation (53.6%) and will continue to take the lead due to the relatively low cost of generation and independence from weather conditions.
The chart of Kenya's energy indices is presented in the figure below.
| Sources: 1. Crude oil proved reserves, 2021 / International Energy Statistic/Geography / U.S. Energy Information Administration (Nov 2021)*98 2. Natural gas proved reserves 2021 / International Energy Statistic / Geography / U.S. Energy Information Administration (Nov 2021) *99 3. Total recoverable coal reserves 2019 / International Energy Statistic / Geography / U.S. Energy Information Administration (Nov 2021) *81 4. Combination production-consumption for Crude oil 2018 / International Energy Statistic / Geography / U.S. Energy Information Administration (Nov 2021) *219 5. Combination production-consumption for Natural gas 2019 / International Energy Statistic / Geography / U.S. Energy Information Administration (Nov 2021) *123 6. Combination production-consumption for Coal 2019 / International Energy Statistic / Geography / U.S. Energy Information Administration (Nov 2021) *128 7. Electricity – from other renewable sources (% of total installed capacity), 2017 est. / The World Factbook / Library / Central Intelligence Agency *170 8. GDP per unit of energy use (PPP per unit of oil equivalent), 2020 *66 Primary energy consumption - BP Statistical Review of World Energy 2021/BP;GDP (purchasing power parity) - The World Factbook/Library/Central Intelligence Agency 9. Energy use (primary energy use of oil equivalent per capita) 2020 *127 Primary energy consumption – BP Statistical Review of World Energy 2021; Population - United Nations, Department of Economic and Social Affairs, Population Division (2019). World Population Prospects 2019, custom data acquired via website. Retrieved 15 November 2021*66 10. The Global Energy Architecture Performance Index Report (EAPI) 2017 / Rankings / Reports / World Economic Forum 11. Electric power consumption (kWh per capita), 2016 *217 Electricity Consumption - The World Factbook / Library / Central Intelligence Agency; Population - United Nations, Department of Economic and Social Affairs, Population Division (2019). World Population Prospects 2019, custom data acquired via website. Retrieved 15 November 2021 12. Combination of electricity production-consumption (kWh)/The World Factbook/Library/Central Intelligence Agency *216 * Total number of countries participating in ranking Figure 4. Energy indices of Kenya |
The fact that the lion's share of Kenya's electricity comes from renewable sources is definitely reflected in the energy index chart, where the country has the highest result among those represented for the Electricity – from other renewable sources (0.95). In addition, Kenya has a relatively good ratio of electricity production to consumption (0.62). Almost all of Kenya's other rankings presented in the chart are well below the global average or are not available at all, as in the case of the main indicators for fossil fuels.
Energy Infrastructure
A territorial map showing distribution of the largest infrastructure projects of the fossil fuel sector and electricity is displayed in Figure 5. Kenya doesn’t have large crude oil, natural gas and coal reserves or they are underexploited. The main oil field extraction activity is located in the north-west area of country, Turkana basin. Kenya imports all of its petroleum product needs by providing product transportation infrastructure, including storage and pipeline services. According to [14], the total length of pipeline infrastructure currently in use is about 1,342 km. The pipeline network runs from the port of Mombasa, where the country's main oil terminal and refinery are also located, to the port of Kisumu (Lake Victoria) with its associated power plants and storage facilities.
According to the Energy and Petroleum Regulatory Authority [14], the installed renewable energy capacity as of June 2022 was 2,481.69 MW, of which 837.58 MW was generated from hydro. Hydropower generation declined in 2021-2022 due to poor hydrology, particularly the fallen levels of the Kiambere and Terquel dams, which are marked on the map below.
As of 2019, Kenya registered some small-scale hydropower plant up to 10 MW with a total installed capacity of 39.4 MW.
Figure 5. Basic Infrastructure facilities of the fossil fuel sector and Electricity production in Kenya
As already mentioned, geothermal energy dominates the country's electricity system. According to [14], Kenya is number one in Africa and seventh in the world in terms of installed geothermal generating capacity. Geothermal plants of various types are concentrated mainly in the west of the country, the largest of which is the Olkaria, consisting of several units with a total capacity of 727 MW.
In Kenya, there has been a significant increase in the use of solar photovoltaic systems. The most powerful of these, Garissa Solar Power, is located in the east of the country and has an installed capacity of about 50 MW.
As of 2022, Kenya has an installed wind capacity of about 440 MW contributing over 16% to country’s energy mix. Lake Turkana (310MW) located in Loiyangalani District, in Marsabit County, is the largest wind plant connected to the grid. Figure 6. Renewable energy in Kenya
Given the significant renewable energy potential in the country, the government of the Republic of Kenya is seeking to expand energy production from renewable sources. The 2017-2037 Power Development Plan foresees that by 2037, renewable energy sources will provide more than 60% of the country's installed energy capacity. Along with ambitions to triple geothermal energy production and double hydro capacity, it is expected that by 2037 the installed capacity of solar energy will increase to 852 MW, and wind energy sources will reach 845 MW [15].
Furthermore, a great deal of attention is paid to bioenergy that contributes 68% of the country’s final energy demand, especially for cooking and heating. The Kenya Bioenergy Strategy 2020-2027 aims to increase the sustainable exploitation of biomass resources and realize the full potential of bioenergy in Kenya. The strategy will support the development of bioenergy as an additional energy source in the medium term and in the long term as an alternative to fossil fuels. The overall stated goal of the Bioenergy Strategy is "sustainable bioenergy for all" by 2028 [16].
Education and Innovation
The following chart shows the position of Kenya in terms of education and innovation:
Sources: 1. The Global Innovation Index 2021, Rankings / Knowledge / World Intellectual Property Organization / Cornell University, INSEAD, and WIPO (2021): Energizing the World with Innovation. Ithaca, Fontainebleau, and Geneva *132 2. Patent Grants 2011-2020, resident & abroad / Statistical country profiles / World Intellectual Property Organization *185 3.Patents in Force 2020 / Statistical country profiles / World Intellectual Property Organization *109 4. QS World University Rankings 2022 *97 5. SCImago Country Rankings (1996-2020) / Country rankings / SCImago, (n.d.). SIR-SCImago Journal & Country Rank [Portal]. Retrieved 17 Nov 2021 *240 6. Internet users in 2018 / The World Factbook / Central Intelligence Agency *229 7. Internet users in 2018 (% Population) / The World Factbook / Central Intelligence Agency *229 8. Government expenditure on education, total (% of GDP), 2019 / United Nations Educational, Scientific, and Cultural Organization (UNESCO) Institute for Statistics. License: CCBY-4.0 / Data as of September 2021*177 9. Research and development expenditure (% of GDP), 2018 / UNESCO Institute for Statistics. License: CCBY-4.0 / Data *119 10. Scientific and technical journal articles, 2018 / National Science Foundation, Science and Engineering Indicators. License: CCBY-4.0 / Data *197 * Total number of countries participating in ranking | ||
| Figure 7. The indices of education and innovation in Kenya |
Like many countries with a large population, Kenya is quite good in terms of the absolute number of Internet users (0.75), but if you look at the number of users as a proportion of the entire population, the country is among the outsiders in this respect (0.12). There are also positives such as Government expenditure on education (0.73) and a relatively high position in the SCImago Country Rankings (0.72). Only one Kenyan university is included in the QS World University Rankings, and it is the weakest point of the country on the chart (0.08). In addition, the lack of information about Patents in force and Kenya's expenditure on research and development leave these two positions blank.
Ecology and Environment Protection
Indicators related to environmental issues are presented in the following diagram:
| Sources: 1. CO2 total emission by countries 2020 / European Commission / Joint Research Centre (JRC) / Emission Database for Global Atmospheric Research (EDGAR)*208 2. CO2 per capita emission 2020/European Commission/Joint Research Centre (JRC) / Emission Database for Global Atmospheric Research (EDGAR) *208 3. Forest area 2020 (% of land area) / The Global Forest Resources Assessment 2020 / Food and Agriculture Organization of the United Nations *234 4. Forest area change 2010-2020 (1000 ha/year) / The Global Forest Resources Assessment 2020 / Food and Agriculture Organization of the United Nations *234 5. The Environmental Performance Index (EPI) 2020 / Rankings / Yale Center for Environmental Law & Policy / Yale University *180 6. Annual freshwater withdrawals (m3 per capita), 2017 *179 Annual freshwater withdrawals, total (billion m3), 2017 – Food and Agriculture Organization, AQUASTAT data. /License: CC BY-4.0; Population – United Nations, Department of Economic and Social Affairs, Population Division (2019). World Population Prospects 2019, custom data acquired via website. Retrieved 15 November 2021 7. The National Footprint Accounts 2017 (Biocapacity Credit / Deficit) / Global Footprint Network *188 8. Methane emissions (kt of CO2 equivalent), 2018 / Data for up to 1990 are sourced from Carbon Dioxide Information Analysis Center, Environmental Sciences Division, Oak Ridge National Laboratory, Tennessee, United States. Data from 1990 are CAIT data: Climate Watch. 2020. GHG Emissions. Washington, DC: World Resources Institute. Available at: License : Attribution-NonCommercial 4.0 International (CC BY-NC 4.0) *191 9. The Climate Change Performance Index (CCPI) 2022 / Overall Results / Jan Burck, Thea Uhlich, Christoph Bals, Niklas Höhne, Leonardo Nascimento / Germanwatch, NewClimate Institute & Climate Action Network *60 * Total number of countries participating in ranking | ||
| Figure 8. Environmental Indices of Kenya |
Kenya faces many environmental challenges, which are reflected in the chart above. These include the small number of forests (0.19), and, most importantly, not very high rates of forests area change (0.32). For indicators such as Annual freshwater withdrawals (0.18), Methane emissions (0.22) and the Environmental Performance Index (0.27) Kenya's position in the rankings is significantly below average. Kenya's most positive indicator is CO2 emissions per capita in 2020 (0.88), while total CO2 emissions are below the global average (0.45). The country is not included in the Climate Change Performance Index (CCPI) 2022.
References
[1] List of sovereign states and dependencies by area / Wikipedia / en.wikipedia.org/wiki/List_of_sovereign_states_and_dependencies_by_area
[2] List of countries and dependencies by population density / Wikipedia / en.wikipedia.org/wiki/List_of_countries_and_dependencies_by_population_density
[3] Kenya / The world factbook / Library / Central Intelligence Agency / www.cia.gov
[4] GDP, PPP (constant 2011 international $) / World Bank, International Comparison Program database. License: CC BY-4.0 / Data / The World Bank / www.worldbank.org
[5] GDP per capita, PPP (current international $) / World Bank, International Comparison Program database. License: CC BY-4.0 / Data / The World Bank / www.worldbank.org
[6] Kenya / Geography / U.S. Energy Information Administration (December, 2022) / www.eia.gov/beta/international/analysis.cfm
[7] BP Statistical Review of World Energy 2020 - 2022 (PDF) / BP / www.bp.com
[8] Solar resource data obtained from the Global Solar Atlas, owned by the World Bank Group and provided by Solargis / Global Solar Atlas / globalsolaratlas.info
[9] Wind Map / Global Wind Atlas 2.0, a free, web-based application developed, owned and operated by the Technical University of Denmark (DTU) in partnership with the World Bank Group, utilizing data provided by Vortex, with funding provided by the Energy Sector Management Assistance Program (ESMAP). For additional information: https://globalwindatlas.info
[10] Agricultural land (% of land area) / Food and Agriculture Organization, electronic files and web site. License: CC BY-4.0 / Data / The World Bank / www.worldbank.org
[11] Forest area (% of land area) / Food and Agriculture Organization, electronic files and web site. License: CC BY-4.0 / Data / The World Bank / www.worldbank.org
[12] 2016 Annual U.S. & Global Geothermal Power Production Report (PDF) / 2016 / Reports / Geothermal Energy Association / geoenergy.org
[13] What a Waste 2012 (PDF) / Resources / The World Bank / www.worldbank.org
[14] ENERGY & PETROLEUM STATISTICS REPORT FOR THE FINANCIAL YEAR ENDED 30th JUNE 2022 / EPRA / www.epra.go.ke
[15] Least cost power development plan 2017-2037 /Republic of Kenya / www.decoalonize.org/wp-content/uploads/2021/03/LCPDP-Least-Cost-Power-Development-Plan-2017-2037-not-2022-updated-June-2018.pdf
[16] BIOENERGY STRATEGY 2020-2027 / energy.go.ke/wp-content/uploads/2021/03/Bioenergy-strategy-final-16112020sm.pdf
The sources of charts and curves are specified under the images.
For more information about the energy industry in Kenya see here