Your Feedback
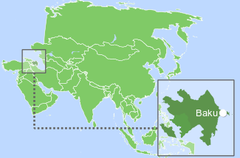
Energy industry in Azerbaijan
License SS BY-SA 4.0 _ Last Updated: March 31, 2024
Download PDF

Contents

General State of the Economy

Azerbaijan, officially the Republic of Azerbaijan, is a landlocked country located in the South Caucasus region of Eurasia, between Western Asia and Eastern Europe. It borders Russia to the north, Iran to the south, Armenia to the west and Georgia to the north-west. Azerbaijan is bounded on the east by the Caspian Sea with a coastline of 713 km.
According to 2022 statistics, Azerbaijan, which in terms of the size of its territory is 113th in the world, is home to around 10,5 million people. In terms of population density, the country is 76th in the world. Azerbaijan is a presidential republic, Baku is the capital and largest city lying on the western shore of the Caspian Sea [1,2,3].

Azerbaijan/Republic of Azerbaijan
Capital: BakuDensity: 117/km2Currency: Manat (₼) (AZN)
Official languages:  AzerbaijaniLife expectancy at birth: 66.87 yearsGDP (PPP): $189.8 billion (2023 est.)
National Day: 18 OctoberArea (land): 86,600 km2GDP - per capita (PPP): $18,310 (2023 est.)
Population: 10,353,296 (2022 est.)Coastline: 713 kmInternet country code: .az

Source: [1,2,3,4,5]
 

Modern Baku. Envato Elements. License BSVFU29RWY

The ranking positions of Azerbaijan relative to other countries have been determined for an extensive list of economic, energy, innovative and educational indices, as well as for metrics reflecting the state of the environment. The economic indices include, for example, GDP per capita, annual average GDP growth, high-technology exports, and others. The list of energy indices includes proven reserves of oil, gas and coal, production-consumption ratio combined, and energy use, etc. Each of the indices has a ranked list of included member countries. Since the number of countries in each rating is different for each index, the positioning of the country of interest is displayed on a special chart, where the vertical axis is a uniform relative scale from 0 to 1, whereas the horizontal axis denominates the various indices and respective numbers relating to the descriptions given underneath.
Thus, in such a relative “0-1” diagram, the country’s position is marked with a dot in proportion to its location in the original rating list. If the country is among the leaders regarding the selected indicator, it will be marked close to 1 in the upper green zone on the relevant chart “0-1”, if the country is an outsider in the rating list, then it will be marked in the lower red zone of the chart “0-1”, etc. A single list of indices is used for all countries. If a country is not in the ranking list for any index, then the corresponding position on the charts is not displayed.

Ranking position of Azerbaijan for list of economic indices:

 Sources:
1. GDP (purchasing power parity), 2020 est. / The World Factbook/Library/Central Intelligence Agency *228
2. GDP - per capita (PPP), 2020 / The World Factbook/Library/Central Intelligence Agency *229
3. Inflation rate (consumer prices), 2019 est. / The World Factbook/Library/Central Intelligence Agency *228
4. Charges for the use of intellectual property, receipts (BoP, current US$), 2020 / International Monetary Fund, Balance of Payments Statistics Yearbook, and data files. / License: CC BY-4.0 *88
5. The Global Competitiveness Index 2019 / Rankings / Reports / World Economic Forum *141
6. High-technology exports (current US$) 2019-2020 / United Nations, Comtrade database through the WITS platform / License: CCBY-4.0 / Data *134
7. 2021 Index of Economic Freedom / International Economies / The Heritage Foundation *178
8. Reserves of foreign exchange and gold, 2017 est. / The World Factbook / Library / Central Intelligence Agency *195
9. Annual average GDP growth in %, for the last 10 years (2011-2020) / World Bank national accounts data, and OECD National Accounts data files / License: CC BY-4.0  *206
10. Public debt (% of GDP), 2017 est. / The World Factbook / Library / Central Intelligence Agency
(from smallest to largest) *210
  * Total number of countries participating in ranking


Figure 1. Economic Indices of Azerbaijan


Of the indices presented, Azerbaijan has the highest values for the 2021 Index of Economic Freedom (0.79), GDP growth dynamics (0.66), and The Global Competitiveness Index (0.59). The weakest spots in Azerbaijani economic indicators are High-technology exports (0.34) and the Annual average GDP growth in %, for the period from 2011 to 2020 (0.20). Data concerning the Use of intellectual property is unavailable, leaving this position in the chart blank.

Energy resources

Azerbaijan has distinct proven reserves of fossil fuels in the form of natural gas and crude oil. The share of natural gas is 0.82% of the world’s total, the share of oil is 0.42% [6]. The share of Azerbaijan's population makes up about 0.13% of the world's population. However, at the same time, gas and oil reserves in Azerbaijan are significantly lower than those of the world leaders. For instance, gas reserves are about 14 times less than in Qatar, while oil reserves are more than 22 times less than in Iran [6].
In terms of tons of oil equivalent, according to 2024 data, conventional proved reserves by fuel type were: 61.6% – natural gas and 38.4% – oil (Fig.5).


Table 1. Fossil energy resources of Azerbaijan

Resource /ExplanationsCrude oil*Natural gas*CoalTight OilShale Gas
Value7 (0.42%)60 (0.82%)---
Unitbillion barrelsTcf---
Year20212020---
Source[6][6][-][-][-]

* share of the country’s reserves in world total is provided in brackets

The geographical location with a diverse landscape of plains and mountains, as well as favorable climatic conditions, give Azerbaijan significant renewable energy potential. According to estimates by the Azerbaijan Renewable Energy Agency, the economically viable and technically feasible renewable energy potential of the country  is 27,000 MW, including 3,000 MW of wind energy, 23,000 MW of solar energy, 380 MW of bioenergy potential, and 520 MW of mountain rivers [7].
The largest technical potential belongs to solar energy, with solar GHI intensity of 4.6-4.9 kWh/m2 in areas of high activity, e.g. in the south-west of the country, in the Nakhchivan region. Azerbaijan also has excellent potential to utilise its wind resources, especially in coastal areas along the Caspian Sea, where wind speed reaches 7.5-8.5 m/s at 50 m.

Table 2. Renewable energy resources of Azerbaijan

Resource/
Explanations
Solar Potential
(GHI)*
Wind Potential
(50 м)*
Bio Potential
(agricultural area)
Bio Potential
(forest area)
Geothermal
Potenial
Municipal Solid
Waste
Value4.1 -4.65.0-7.557.813.78000.82
UnitkWh/m2/daym/s% of land area% of land areaMWekg/per capita/day
Year202020202020202020142018
Source[8][9][10][11][12][13]

*for the majority of the territory of the country

In addition, the country also has good potential for small-scale hydropower. According to [14] , the estimated technical potential of small hydropower plants in Azerbaijan is 520 MW. However, only 5% of it is currently being utilised.
In addition to the mentioned renewable energy development areas, Azerbaijan also has a technical potential of 300 MW of biomass and waste to produce energy. Currently, bioenergy is mainly used in the form of conventional biomass, mainly for cooking and heating in remote areas. A solid waste incineration plant in Baku with an installed capacity of 37 MW is working to realise this potential [14].

Energy Balance

According to [6], in 2022 in Azerbaijan, the total production of primary energy was 2.703 quadrillion Btu, while consumption was at the level of 0.637 quadrillion Btu. Thus, the share of domestic consumption in primary energy production was 23,6%. This makes Azerbaijan a country independent of energy imports (without taking into account the structure of energy consumption).
According to the Statistical Review of World Energy 2022, primary energy consumption in Azerbaijan in 2021 amounted to 0.66 exajoules and was dominated by natural gas – 69.7.5%, ahead of oil – 28.8% and hydro – 1.52% [15]. 

Source: U.S. Energy Information Administration (Mar 2024) / www.eia.gov

Figure 2. The Production and Consumption of fossil fuels in Azerbaijan (left — coal, in the center — gas, right — oil)

As can be seen from the diagram above, natural gas output in Azerbaijan has gradually increased over the past ten years, and production is more than twice as high as domestic consumption. In contrast, oil production began a small and gradual decline in 2010 after reaching record highs driven by the discovery of the Shah Deniz field in the South Caspian in 1999. It should be noted, that oil production is about seven times higher than domestic consumption. In 2015, coal consumption in Azerbaijan dropped to practically zero, but then began to grow sharply again and within five years, from 2016 to 2022, increased approximately 140 times.

                                       
Sources: U.S. Energy Information Administration (Mar 2024) / www.eia.gov
 
 Figure 3. Electricity Generation in  Azerbaijan 

Over the past ten years, total electricity production in Azerbaijan has increased by almost 20%. In 2022, about 94% of electricity was generated by natural gas-fired power plants. The country has a number of hydroelectric power plants, which contribute about 5,5% to the overall balance of electricity production. The amount of renewable power plants is insignificant in Azerbaijan reaching about 0.9% of the total production.
The volume of electricity generation in Azerbaijan slightly exceeds the volume of consumption, allowing the country to export the remaining production.

 Sources:
1. Crude oil proved reserves, 2021 / International Energy Statistic/Geography / U.S. Energy Information Administration (Nov 2021)*98
2. Natural gas proved reserves 2021 / International Energy Statistic / Geography / U.S. Energy Information Administration (Nov 2021) *99
3. Total recoverable coal reserves 2019 / International Energy Statistic / Geography / U.S. Energy Information Administration (Nov 2021) *81
4. Combination production-consumption for Crude oil 2018 / International Energy Statistic / Geography / U.S. Energy Information Administration (Nov 2021) *219
5. Combination production-consumption for Natural gas 2019 / International Energy Statistic / Geography / U.S. Energy Information Administration (Nov 2021) *123
6. Combination production-consumption for Coal 2019 / International Energy Statistic / Geography / U.S. Energy Information Administration (Nov 2021) *128
7. Electricity – from other renewable sources (% of total installed capacity), 2017 est. / The World Factbook / Library / Central Intelligence Agency *170
8. GDP per unit of energy use (PPP per unit of oil equivalent), 2020 *66
Primary energy consumption - BP Statistical Review of World Energy 2021/BP;
GDP (purchasing power parity) - The World Factbook/Library/Central Intelligence Agency
9. Energy use (primary energy use of oil equivalent per capita) 2020  *127
Primary energy consumption – BP Statistical Review of World Energy 2021; Population - United Nations, Department of Economic and Social Affairs,
Population Division (2019). World Population Prospects 2019, custom data acquired via website. Retrieved 15 November 2021
*66
10. The Global Energy Architecture Performance Index Report (EAPI) 2017 / Rankings / Reports / World Economic Forum
11. Electric power consumption (kWh per capita), 2016 *217
Electricity Consumption - The World Factbook / Library / Central Intelligence Agency; Population - United Nations, Department of Economic and Social Affairs,
Population Division (2019). World Population Prospects 2019, custom data acquired via website. Retrieved 15 November 2021

12. Combination of electricity production-consumption (kWh)/The World Factbook/Library/Central Intelligence Agency *216

* Total number of countries participating in ranking

Figure 4. Energy indices of Azerbaijan


The energy indices presented in the diagram above clearly demonstrate Azerbaijan's strong performance in terms of fossil fuel reserves. The highest indicators of the country are Production-consumption combination for crude oil (0.95) and for natural gas (0.85). The crude oil and natural gas reserve values in the global comparison are somewhat lower (both 0.80). Azerbaijan have virtually no reserves of coal leaving this position in the chart blank. According to the primary statistics, Azerbaijan has a relatively good electricity generation to consumption ratio (0.73). The insignificant amount of electricity from renewable sources is reflected as the weakest energy indicator among the ones presented in the chat (0.22).

Energy Infrastructure


The core oil and gas infrastructure of Azerbaijan has developed in the eastern part of the country within the Baku oil- and gas-bearing district located on the Apsheron Peninsula and the adjacent Caspian Sea, where most of the country's oil and gas production takes place. The largest gas production areas – the Shah Deniz and Umid fields – are located offshore.
Azerbaijan is a net exporter of energy resources and an important supplier of oil and natural gas, especially for European markets. There are 2446 km of oil pipelines in the country, with the Baku-Tbilisi-Ceyhan pipeline providing the main export capacity, transporting oil from the Sangachal terminal through Georgia and Turkey to world markets. Conventional natural gas infrastructure includes 3890 km of natural gas and 89 km of condensate pipelines.

Map of oil and gas infrastructure in Azerbaijan
Figure 5. Basic infrastructural facilities of the fossil fuel sector in Azerbaijan

As already mentioned, according to the U.S. Energy Information Administration data, in 2021, 93.9% of electricity in Azerbaijan was generated by fossil fuels power plants, mainly driven by gas. Almost all of them are concentrated in the eastern part of the country.
However, based on data from the Azerbaijan Renewable Energy Agency [16], by 2023 the share of renewable energy sources in the total installed capacity is already about 17%, dominated by hydropower (88.5%), ahead of wind (5%), solar (3.5%) and bioenergy (3%). The installed capacity of hydroelectric power plants is about 1,110 MW, 70% of which comes from the two largest HPPs located on the Kura River – 402 MW Mingachevir HPP and 380 MW Shamkir HPP.
The installed capacity of wind and solar power plants together comprise 112 MV. The largest wind power project is 50 MW Yeni Yashma Wind Park in Khizi District in the north-east of Azerbaijan. The 22 MW Naxçıvan Solar Power Plant is the largest operating solar farm in the country located in the south-western Babek District [16].

Map of Electricity and Renewable energy infrastructure in Azerbaijan
Figure 6. Electricity production and Renewable energy in Azerbaijan

Due to the dominance of the oil and gas sector, the share of renewable energy sources in Azerbaijan is significantly lower than the world average. Over the last few years, the government of the country has made a lot of efforts to create cooperations and attract investments in the renewable energy market, so this area is expected to grow rapidly in the medium term. According to the Azerbaijan Renewable Energy Agency [16], among the main renewable energy projects, the construction of which started in 2022, are the 240 MW Khizi-Absheron Wind Power Plant and the 230 MW Garadagh Solar Power Plant. The total investment in these two projects is $500 million. In addition, it should be mentioned that two hydropower plants are underway on the Aras River in the Jabrayil district with a total capacity of 140 MW.

Education and Innovation


The following chart shows Azerbaijan’s positions in terms of education and innovation:

 
Sources:
1. The Global Innovation Index 2021, Rankings / Knowledge / World Intellectual Property Organization / Cornell University, INSEAD, and WIPO (2021):
Energizing the World with Innovation. Ithaca, Fontainebleau, and Geneva *132
2. Patent Grants 2011-2020, resident & abroad / Statistical country profiles / World Intellectual Property Organization *185
3.Patents in Force 2020 / Statistical country profiles / World Intellectual Property Organization *109
4. QS World University Rankings 2022 *97
5. SCImago Country Rankings (1996-2020) / Country rankings / SCImago, (n.d.). SIR-SCImago Journal & Country Rank [Portal]. Retrieved 17 Nov 2021 *240
6. Internet users in 2018 / The World Factbook / Central Intelligence Agency *229
7. Internet users in 2018 (% Population) / The World Factbook / Central Intelligence Agency *229
8. Government expenditure on education, total (% of GDP), 2019 / United Nations Educational, Scientific, and Cultural Organization (UNESCO) Institute for Statistics.
License: CCBY-4.0 / Data as of September 2021*177
9. Research and development expenditure (% of GDP), 2018 / UNESCO Institute for Statistics. License: CCBY-4.0 / Data *119
10. Scientific and technical journal articles, 2018 / National Science Foundation, Science and Engineering Indicators. License: CCBY-4.0 / Data *197
  * Total number of countries participating in ranking
 
 Figure 7. The indices of education and innovation in Azerbaijan 

Azerbaijan's education and innovation indicators are highly heterogeneous. On the one hand, they demonstrate the relatively good position of the country in terms of Patents granted (0.72) and Scientific and technical journal articles (0.58). On the other hand, there is insufficient support from the state, which is reflected in low indicators for Government expenditure on education (0.14) and Research and development expenditure (0.24). The country has a good score for internet users, both in general (0.74) and relative to the population (0.72).

Ecology and Environment Protection

Indicators related to environmental issues are presented in the following diagram:

 Sources:
1. CO2 total emission by countries 2020 / European Commission / Joint Research Centre (JRC) / Emission Database for Global Atmospheric Research (EDGAR)*208
2. CO2 per capita emission 2020/European Commission/Joint Research Centre (JRC) / Emission Database for Global Atmospheric Research (EDGAR) *208
3. Forest area 2020 (% of land area) / The Global Forest Resources Assessment 2020 / Food and Agriculture Organization of the United Nations *234
4. Forest area change 2010-2020 (1000 ha/year) / The Global Forest Resources Assessment 2020 / Food and Agriculture Organization of the United Nations *234
5. The Environmental Performance Index (EPI) 2020 / Rankings / Yale Center for Environmental Law & Policy / Yale University *180
6. Annual freshwater withdrawals (m3 per capita), 2017 *179
Annual freshwater withdrawals, total (billion m3), 2017 – Food and Agriculture Organization, AQUASTAT data. /License: CC BY-4.0; 
Population – United Nations, Department of Economic and Social Affairs, Population Division (2019).
World Population Prospects 2019, custom data acquired via website. Retrieved 15 November 2021
7. The National Footprint Accounts 2017 (Biocapacity Credit / Deficit) / Global Footprint Network *188
8. Methane emissions (kt of CO2 equivalent), 2018 / Data for up to 1990 are sourced from Carbon Dioxide Information Analysis Center, Environmental Sciences Division,
Oak Ridge National Laboratory, Tennessee, United States. Data from 1990 are CAIT data: Climate Watch. 2020. GHG Emissions. Washington, DC: World Resources Institute.
Available at: License : Attribution-NonCommercial 4.0 International (CC BY-NC 4.0)  *191
9. The Climate Change Performance Index (CCPI) 2022 / Overall Results / Jan Burck, Thea Uhlich, Christoph Bals, Niklas Höhne, Leonardo Nascimento /
Germanwatch, NewClimate Institute & Climate Action Network *60

  * Total number of countries participating in ranking
 
 Figure 8. Environmental Indices of Azerbaijan 

Half of the indicators characterising Azerbaijan's environmental issues are below the world average. This includes both total CO2 emissions (0.33) and per capita (0.44), as well as methane emissions (0.21), contributing significantly to the country's relatively low ranking in the National Footprint Accounts (0.39). In Azerbaijan, as can be seen from the diagram, the area of forests is relatively small (0.32), but their number at least increases stable in recent years (0.89). The country is not included in the Climate Change Performance Index (CCPI) 2022, so this position in the chart remains unfilled. Among the country's positive environmental characteristics is its annual freshwater withdrawal (0.96), which is very high, compared to other countries. In general, the environmental situation in Azerbaijan requires significant improvement.

References

[1] List of sovereign states and dependencies by area / Wikipedia / en.wikipedia.org/wiki/List_of_sovereign_states_and_dependencies_by_area
[2] List of countries and dependencies by population density / Wikipedia / en.wikipedia.org/wiki/List_of_countries_and_dependencies_by_population_density
[3] Azerbaijan / The world factbook / Library / Central Intelligence Agency / www.cia.gov
[4] GDP, PPP (constant 2011 international $) / World Bank, International Comparison Program database. License: CC BY-4.0 / Data / The World Bank / www.worldbank.org
[5] GDP per capita, PPP (current international $) / World Bank, International Comparison Program database. License: CC BY-4.0 / Data / The World Bank / www.worldbank.org
[6] International Energy Statistic / Geography  / U.S. Energy Information Administration (Dec 2022) / www.eia.gov/beta/international/
[7] Azerbaijan Renewable Energy Agency / Potential of RE / area.gov.az/en/page/yasil-texnologiyalar/boem-potensiali
[8] Solar resource data obtained from the Global Solar Atlas, owned by the World Bank Group and provided by Solargis / Global Solar Atlas / globalsolaratlas.info
[9] Wind Map / Global Wind Atlas 2.0, a free, web-based application developed, owned and operated by the Technical University of Denmark (DTU) in partnership with the World Bank Group, utilizing data provided by Vortex, with funding provided by the Energy Sector Management Assistance Program (ESMAP). For additional information: globalwindatlas.info
[10] Agricultural land (% of land area) /Food and Agriculture Organization, electronic files and web site. License: CC BY-4.0 / Data / The World Bank / www.worldbank.org
[11] Forest area (% of land area) /Food and Agriculture Organization, electronic files and web site. License: CC BY-4.0 / Data / The World Bank / www.worldbank.org
[12] 2016 Annual U.S. & Global Geothermal Power Production Report (PDF) / Geothermal Energy Association / http://geo-energy.org/
[13] What a Waste 2.0 (PDF) / Resources / The World Bank / www.worldbank.org
[14] In-Depth Review of the Energy Efficiency Policy of the Republic of Azerbaijan / www.energycharter.org/fileadmin/DocumentsMedia/IDEER/IDEER-Azerbaijan_2020.pdf
[15] BP Statistical Review of World Energy 2020-2022 (PDF) / BP / www.bp.com
[16] Azerbaijan Renewable Energy Agency / Projects / area.gov.az/en/page/layiheler


The sources of charts and curves are specified under the images.

For more information about the energy industry in Azerbaijan see here