
Contents
General State of the Economy
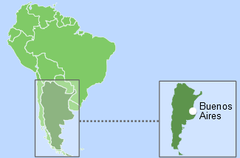
In terms of population density, Argentina is far behind Brazil and Columbia, ranking 217th in the world, with an average density of 16 people per 1 km2 [2]. The total length of the country's coastline is 4 989 km [3]. As of 2021, the country is home to around 45.6 million people [1], with around a third of the population concentrated in metropolitan areas. Argentina is a presidential republic with its administrative map divided into 23 states; the official language is Spanish [3].
| Argentine Republic/ República Argentina | ||
|---|---|---|
| Capital: Buenos Aires | Density: 14.4/km2 | Currency: peso ($) (ARS) |
| Official languages: Spanish | Life expectancy at birth: 75.89 years | GDP (PPP): $1.274 trillion (2023 est.) |
| National Day: 09 July | Area: 2,780,400 km2 | GDP - per capita (PPP): $27,261 (2023 est.) |
| Population: 46,621,847 (2023 est.) | Coastline: 4,989 km | Internet country code: .ar |
Source: [1,2,3,4,5]
Historically, agriculture has occupied an important place in the national economy, with Argentina being one of the world’s largest exporters of agricultural products. Despite having a relatively large resource base, some of Argentina’s economic indicators are lower than the world average (Fig.1.), however, for a number of indicators, such as GDP, foreign exchange reserves and gold, high-technology exports, and the market value of publicly-traded shares, the country ranks either higher or close to the global average. Between 2002-2008, the country experienced a steady growth of GDP at purchasing power parity, before slowing and undergoing a decline between 2008- 2009 [4]. From $913.2 billion in 2015 the indicator rose to $1,012,670 billion in 2018, but due to the COVID-19 pandemic, the GDP in purchasing power parity fell to $893.31 billion in 2020, which did not prevent Argentina from ranking 27th in the world ranking for this indicator [3]. GDP at purchasing power parity per capita is significantly lower (86th in 2020), which has also been demonstrating negative dynamics: $21 200 in 2015, $20 900 in 2017 and $ 19 700 in 2020 [3].
| Sources: 1. GDP (purchasing power parity), 2020 est. / The World Factbook/Library/Central Intelligence Agency *228 2. GDP - per capita (PPP), 2020 / The World Factbook/Library/Central Intelligence Agency *229 3. Inflation rate (consumer prices), 2019 est. / The World Factbook/Library/Central Intelligence Agency *228 4. Charges for the use of intellectual property, receipts (BoP, current US$), 2020 / International Monetary Fund, Balance of Payments Statistics Yearbook, and data files. / License: CC BY-4.0 *88 5. The Global Competitiveness Index 2019 / Rankings / Reports / World Economic Forum *141 6. High-technology exports (current US$) 2019-2020 / United Nations, Comtrade database through the WITS platform / License: CCBY-4.0 / Data *134 7. 2021 Index of Economic Freedom / International Economies / The Heritage Foundation *178 8. Reserves of foreign exchange and gold, 2017 est. / The World Factbook / Library / Central Intelligence Agency *195 9. Annual average GDP growth in %, for the last 10 years (2011-2020) / World Bank national accounts data, and OECD National Accounts data files / License: CC BY-4.0 *206 10. Public debt (% of GDP), 2017 est. / The World Factbook / Library / Central Intelligence Agency (from smallest to largest) *210 * Total number of countries participating in ranking Figure 1. Economic Indices of Argentina |
In 2017, inflation in Argentina reached a critical value of 25.7%–221st place in the world [3]. According to the Global Competitiveness Report 2019, presented by the World Economic Forum8, Argentina ranks 83rd out a total of 141 countries considered, behind the neighbouring countries Chile and Brazil. This rating measures the effectiveness of the use of the country’s own resources for sustainable development. In addition to a number of economic indicators this index also takes into account such variables as education, health, level of innovation, etc. In terms of high-technology exports, between 2019-2020 Argentina was 60th out of a total of 134 countries considered, ahead of Chile and Peru.
According to the Index of Economic Freedom in 2021, which takes into account business freedom, freedom from government intervention, protection of property, and freedom from corruption, Argentina was 148th out of 178 countries. According to the indicator for the average GDP growth in percentage over the last 10 years (2011-2020), the country was 187th out of 206 countries in 2020. In terms of public debt, calculated as a percentage of the country's GDP, Argentina was ranked 77th out of 210 countries considered in 2017.
Energy Resources
Argentina has large natural resources (Table 1). There are large deposits of natural gas, including shale gas, and small deposits of coal. Oil resources are represented by conventional oil, light (tight) oil, and kerogen oil. In terms of tons of oil equivalent, proven reserves of conventional hydrocarbons as of 2021 are: oil – 32.4%, gas –34.1%, and coal –33.5% (see Fig.5). The unconventional natural resource matrix is as follows: shale gas –85%; shale oil (tight oil) – 14.8%; and kerogen oil –0.2% (Fig. 5).
Table 1. Fossil energy resources of Argentina
| Resource /Explanations | Crude oil* | Natural gas* | Coal* | Shale Gas** | Tight Oil** | Oil Shale*** |
|---|---|---|---|---|---|---|
| Value | 2.48(0.15%) | 13.1(0.18%) | 551.2(0.05%) | 801.5 | 27 | 400 |
| Unit | billion barrels | Tcf | million short tons | Tcf | billion barrels | million barrels |
| Year | 2021 | 2020 | 2021 | 2013 | 2013 | 2008 |
| Source | [21] | [21] | [21] | [8] | [8] | [10] |
*share of the country’s reserves in world total is provided in brackets
**unproved technically recoverable
***in place resources
In 2018 proven oil reserves in Argentina [3,6] were estimated at 2-2.162 billion barrels. According to the Argentinian “Secretaria de Gobierna de Energia,” proven conventional oil reserves were around 320.6 million m3 in 2017 [7]. Argentina has the largest reserves of oil shale (tight) oil in the region –approximately 27 billion barrels as of 2013 [8]. The country is second in the region after Brazil in terms of kerogen oil reserves, which totalled to 400 million barrels in 2008 [10].
Proven reserves of natural gas in Argentina in 2018 were estimated at 300-336.6 Bcm [3,6]. According to “Secretaria de Gobierna de Energia," proven reserves of natural gas in 2017 were estimated to be 355.459 million m3 [7]. It should be noted that the total reserves of conventional and unconventional gas are 5 times higher than similar reserves of liquid hydrocarbons.
According to [8], in 2013 unproven technically recoverable shale gas reserves in amounted to 801.5 Tcf; the largest reserves in the region and second only to China globally. Coal reserves are mainly concentrated in the south of the country and were estimated at 499.86 million tons in 2015 [11]. Argentina has a significant resource potential for the development of clean energy production. A selection of basic indicators of this type of resource is presented in Table 2.
Table 2. Renewable energy resources of Argentina
| Resource/ Explanations | Solar Potential (DNI)* | Wind Potential (50 м)* | Hydro energy Potential** | Bio Potential (agricultural area) | Bio Potential (forest area) | Municipal Solid Waste |
|---|---|---|---|---|---|---|
| Value | 5.5 - 6.8 | 5.0 - 6.0 | 169 | 53.9 | 10.7 | 1.22 |
| Unit | kWh/m2/day | m/s | TWh/year | % of land area | % of land area | kg/per capita/day |
| Year | 2018 | 2018 | 2009 | 2016 | 2016 | 2012 |
| Source | [12] | [13] | [17] | [14] | [15] | [19] |
* for the majority of the territory of the country
** technically exploitable capability
The typical level of direct solar irradiation is relatively high –5.5-6.8 kWh/m2/day. The highest level of solar radiation can be observed in the north-west, on the border with Chile and Bolivia, at over 9.5 kWh/m2/day [12]. The distribution of wind resources is as follows: wind speed in the majority of the country is between 5.0-6.0 m/sec; the maximum registered speed was in the southern coastal regions, where wind speeds may exceed 9.5 m/sec (at a height of 50 m) [13].
10.7% of Argentina is forested with around 53.9% covered by agricultural land [14,15]. Waste production from the agricultural sector has the potential to have a significant impact on the volume of energy production, although at present bioenergy production volumes in Argentina are low. In Argentina there are some fairly large and deep rivers that offer significant potential for hydropower development. These include the Parana basin (second in length and basin area in South America [16]), and the Paraguay, Uruguay and La Plata River Basin. Gross theoretical hydropower potential in the country is 169 000 GWh/year; the second largest in South America after Brazil [17].
In the south of the country there is potential for tidal energy, which can reach 20 kW/m [18]. Argentina generates 1,22 kg of municipal waste per capita per day. This is a valuable raw material for recycling or energy production, but long decaying organic and other hazardous substances produced by the process can be damaging to the environment [19].
Energy Balance
According to ВР, primary energy consumption in Argentina in 2020 totalled 3.15 Exajoules and was dominated by gas - 50.2%, followed by oil – 32.7%, hydropower – 8.6%, nuclear energy – 2.9%, coal – 1% and renewables – 4.1% [6]. In 2016, Argentina was the largest producer of natural gas and the fourth largest producer of oil and oil products in the region [20]. The volume of oil production in Argentina gradually decreased between 2002 and 2020 (Fig.2).
Source: U.S. Energy Information Administration (Sep 2023) / www.eia.gov
Figure 2. The production and consumption of fossil fuels in Argentina (coal – left, gas – in the center, oil – right)
According to [21] in 2020 oil production in Argentina amounted to 635 thousand bbl/day; according to [3] – 489 000 bbl/day in 2018; and according to BP [6] – 600 thousand bbl/day in 2020. Oil consumption reached 449 thousand bbl/day in 2020 [21]. In 2020, according to BP’s report, oil consumption was 503 thousand barrels per day [6]. Up until 2012 Argentina exported oil, however, due to the rapid growth of domestic demand, the country was forced to start importing oil, but in 2016 it resumed its exports (Fig. 2). Imports of oil and oil products in 2015 totalled 16 740 bbl/day [3], while exports totalled 36 630 bbl/day.
Gas production between 2002 and 2006 increased significantly, before subsequently decreasing, reaching a low of 1 254 Bcf in 2015, after which increased again, reaching the level of 1 605 Bcf in 2019 [21]. In 2017, according to [3], production was 40.92 Bcm; according to [6] production was 38.3 Bcm in 2020. Gas consumption between 2002 and 2017 demonstrated steady growth and in 2019 was 1 747 Bcf [21]; according to [3] it was at the level of 49.04 Bcm. In 2020, according to a statistical report from BP, gas consumption was 43.9 Bcm [6]. Up until 2007, the country exported natural gas, however, as with oil, due to increased domestic consumption, Argentina has been forced to import this resource. In 2017, the import figure was 9.8 Bcm, and the export figure was 76.45 million m3 [3].
Coal production in Argentina over the last 10 years, not exceeding 0.18 million short tons [21]. At the same time consumption levels have grown steadily until 2018, and went down starting in 2019. In 2020 coal consumption was 0.03 Exajoules [21,6]. Historically, Argentina has a high share of mineral resources in electricity production (Fig. 3).
Sources: U.S. Energy Information Administration (Dec 2021) / www.eia.gov | ||
| Figure 3. Electricity production in Argentina |
According to U.S. Energy Information Administration, in 2020 Argentina produced 137.8 TWh of electricity, of which 65.8% was from thermal power plants using fossil fuels, 17.5% from hydroelectric plants, 7.3% from nuclear power plants, and 9.4% from renewable energy (Fig.6). Argentina’s position in the comparative diagram of energy index is shown in Figure 4. The first three indices - based on reserves of fossil fuels and export opportunities - show Argentina’s strong competitive position in the global market. However, the country shows a great imbalance between production and consumption of fossil fuels.
| Sources: 1. Crude oil proved reserves, 2021 / International Energy Statistic/Geography / U.S. Energy Information Administration (Nov 2021)*98 2. Natural gas proved reserves 2021 / International Energy Statistic / Geography / U.S. Energy Information Administration (Nov 2021) *99 3. Total recoverable coal reserves 2019 / International Energy Statistic / Geography / U.S. Energy Information Administration (Nov 2021) *81 4. Combination production-consumption for Crude oil 2018 / International Energy Statistic / Geography / U.S. Energy Information Administration (Nov 2021) *219 5. Combination production-consumption for Natural gas 2019 / International Energy Statistic / Geography / U.S. Energy Information Administration (Nov 2021) *123 6. Combination production-consumption for Coal 2019 / International Energy Statistic / Geography / U.S. Energy Information Administration (Nov 2021) *128 7. Electricity – from other renewable sources (% of total installed capacity), 2017 est. / The World Factbook / Library / Central Intelligence Agency *170 8. GDP per unit of energy use (PPP per unit of oil equivalent), 2020 *66 Primary energy consumption - BP Statistical Review of World Energy 2021/BP;GDP (purchasing power parity) - The World Factbook/Library/Central Intelligence Agency 9. Energy use (primary energy use of oil equivalent per capita) 2020 *127 Primary energy consumption – BP Statistical Review of World Energy 2021; Population - United Nations, Department of Economic and Social Affairs, Population Division (2019). World Population Prospects 2019, custom data acquired via website. Retrieved 15 November 2021*66 10. The Global Energy Architecture Performance Index Report (EAPI) 2017 / Rankings / Reports / World Economic Forum 11. Electric power consumption (kWh per capita), 2016 *217 Electricity Consumption - The World Factbook / Library / Central Intelligence Agency; Population - United Nations, Department of Economic and Social Affairs, Population Division (2019). World Population Prospects 2019, custom data acquired via website. Retrieved 15 November 2021 12. Combination of electricity production-consumption (kWh)/The World Factbook/Library/Central Intelligence Agency *216 * Total number of countries participating in ranking Figure 4. Energy indices of Argentina |
In terms of the share of electricity production from renewable energy sources (excluding hydropower), Argentina places low in the global ranking – 119th out of 170 countries selected for consideration. However, other indices look more convincing. Argentina is ranked 28th, in the EAPI of 2017 (Energy Architecture Performance Index), behind Peru, but ahead of Mexico and the US. This metric is based principally on the level economic growth, environmental safety, and energy independence of the country, including access to energy. Over the last 7 years the country has gained 21 positions in the rating.
Argentina is in the lower half of the ranked list of countries for such indicators as GDP per unit of energy use in 2020 – 27th out of 66 countries considered, while energy consumption per capita is even lower – 46th out of 66 countries. In terms of electricity consumption per capita, the country is 94th in the world. In terms of combined electricity production-consumption, Argentina is 33rd in the ranked list of 216 countries.
Energy Infrastructure
A territorial map showing the distribution of the largest infrastructure projects of the fossil-fuel sector in Argentina is shown in Figure 5. As mentioned above, oil reserves account for around 32.4% of the domestic energy potential of fossil fuels. The largest oil field in Argentina is Cerro Dragón, in the Golfo San Jorge basin (Fig.5) [22].
Figure 5. Basic infrastructural facilities of the fossil fuel sector in Argentina
According to estimates [22], this oil field contains more than 1 billion barrels. Argentina's leading oil production company is YPF, which owns 59 oil fields. The second largest is Pan American Energy (PAE), owned by BP and the Bridas Corporation, which accounts for 19% of total production [23]. Carina and Aries offshore gas field is located in the Tierra del Fuego basin, with peak production figures of 15 million m3/ day [24]. Argentina has the second largest reserves of shale gas in the world; the main reserves are concentrated in the Vaca Muerta field (Neuquen basin), with estimated reserves of 308 Tcf [20].
Three types of oil pipelines connect oil fields with the major refineries: pipelines for crude oil with a total length of 6 248 km; oil pipelines for the transportation of petroleum products with a length of 3 631 km; and a liquefied petroleum gas pipeline 41 km long (Fig.5). Refineries in Argentina have a total installed capacity of 630 600 barrels/day (Figure 5). YPF manages three refineries, the largest of which is Refineria de La Plata, with an installed capacity of 189 thousand bbl/day [25]. The key oil terminals are Puerto Dock Sud, near Buenos Aires, and Comodoro Rivadavia in the south of the country (Figure 5). Major storage facilities are concentrated in the central and southern regions; the largest is Puerto Rosales, with a storage capacity of 480 000 m3 or 3 million bbl [26].
Natural gas processing infrastructure can be found in the central, northern, and southern regions. The Etano gas processing plant has an installed capacity of 18 million m3 [27]. Major LNG import terminals are located near the capital and in Bahia Blanca. The terminals have a capacity of 500 Mcf/day [28]. The main LNG exporter to Argentina is Trinidad and Tobago. In 2016, LNG imports totalled 175 Bcf [20]. Gas imports from Bolivia, as well as its transportation between LNG terminals, gas processing plants and power plants, is carried out through gas pipelines with a total length of 29 930 km [3].
The main coal extraction field is Rio Turbio, with 100 million tonnes of recoverable coal reserves [29]. Figure 6 shows the most notable facilities in Argentina producing electrical energy. Fossil fuels are predominant in the share of electricity production, amounting to around 65.8% in 2020; this is followed by hydropower with an approximately 17.5% share, nuclear power with 7.3%, and solar and wind energy with 9.4% (Fig.6). Fossil fuel power generation mainly utilizes oil and gas. There are 11 combined cycle power plants rated at over 600 MW, and 7 large gas power plants rated at over 200 MW (Figure 6).
Figure 6. Electricity production in Argentina
The largest combined cycle power plant is Costanera, with a capacity of 2324 MW,. The largest gas power plant is Genelba, with a capacity of 825 MW [30,31]. The biggest coal-fired plant is Rio Turbio, with two blocks of 120 MW, and the largest nuclear power plant is Atucha I and II, with an installed capacity of more than 1107 MW [32,33]. In 2019 hydropower generated around 34.7 TWh; installed capacity was estimated at 10.4 GWe in 2020 (Figure 7).
The country's largest hydroelectric power station is Yacyreta, which generates 20 091 TWh annually, with a capacity of 3 100 MW [34]. In Figure 7, you can see the main facilities of the Argentinian infrastructure for the production of energy from renewable sources.
Figure 7. Renewable energy in Argentina
As noted above, renewable energy in Argentina, excluding hydro power, does not have a significant share in energy production. The total production of electricity from renewable sources in 2019, with the exception of hydro power, reached nearly 8 TWh; of this, wind energy had the largest share, followed by bioenergy and solar energy (Fig.7). Nationwide, there are enterprises for processing biomass, biogas, biodiesel, bioethanol, and LFG (landfill gas). Compania Bioenergetica La Florida manages the largest biomass processing plant, La Florida, with an installed capacity of more than 62 MW [35]. San Miguel Norte III power plant, which produces landfill gas, has an installed capacity of 11.8 MW and provides electricity for around 25 000 Argentinian households [36]. ProMaiz produces around 147 000 tons of bioethanol annually at the country's largest enterprise – Alejandro Rosa [37]. The LDC company has successfully implemented modern technology biodiesel production. The company's largest plant, General Lagos, produces 605 000 Tm of biodiesel annually [38].
The level of solar radiation in the most populated areas of the country can reach 9.5 kWh/m2/day, and wind speed levels exceed 8.5 m/s, providing an excellent resource for energy production [12,13]. There are 5 wind farms with an installed capacity of over 5 MW, and 4 solar stations rated over 1 MW (Figure 7). The largest solar station is Canada Honda with an installed capacity of 22 MW, and the largest wind farm is Rawson, rated at 80 MW [39,40]. The Comodoro Rivadavia electrolysis hydrogen plant has a capacity of 1,4 MW [41]. In 2011 there was a significant growth of new capacities in the renewable energy sector (excluding hydro power), from 148 GWh in 2011 to 650 GWh in 2015 [42]. To date, the country’s National Energy Strategy is primarily focused on increasing the share of renewable energy in electricity production and the diversification of energy sources. Within the framework of energy strategy between 2018-2025, it is planned to meet 100% of domestic demand by only using the national resources of the country. It is also planned to establish a trust fund to finance the energy sector, as well as a 2-3 GW increase in renewable energy capacity [43].
Education and Innovation
The set of indices reflecting the position of Argentina in comparison to other countries in the field of education and innovation can be seen in Figure 8. According to the number of patents granted to Argentinian nationals, both domestically and abroad, the country ranks 47th in the world, indicating the country's favourable conditions for innovation. According to the Index of Global Innovation, Argentina ranks 73rd out of 132 countries considered (see the diagram for links).
| Sources: 1. The Global Innovation Index 2021, Rankings / Knowledge / World Intellectual Property Organization / Cornell University, INSEAD, and WIPO (2021): Energizing the World with Innovation. Ithaca, Fontainebleau, and Geneva *132 2. Patent Grants 2011-2020, resident & abroad / Statistical country profiles / World Intellectual Property Organization *185 3.Patents in Force 2020 / Statistical country profiles / World Intellectual Property Organization *109 4. QS World University Rankings 2022 *97 5. SCImago Country Rankings (1996-2020) / Country rankings / SCImago, (n.d.). SIR-SCImago Journal & Country Rank [Portal]. Retrieved 17 Nov 2021 *240 6. Internet users in 2018 / The World Factbook / Central Intelligence Agency *229 7. Internet users in 2018 (% Population) / The World Factbook / Central Intelligence Agency *229 8. Government expenditure on education, total (% of GDP), 2019 / United Nations Educational, Scientific, and Cultural Organization (UNESCO) Institute for Statistics. License: CCBY-4.0 / Data as of September 2021*177 9. Research and development expenditure (% of GDP), 2018 / UNESCO Institute for Statistics. License: CCBY-4.0 / Data *119 10. Scientific and technical journal articles, 2018 / National Science Foundation, Science and Engineering Indicators. License: CCBY-4.0 / Data *197 * Total number of countries participating in ranking Figure 8. The indices of education and innovation in Argentina |
24 Argentinian universities have been included in the QS University Rating; the second highest result in the region after Brazil, despite having indicators that are below the world average. Argentina is well positioned when considering the number of publications of specialists in scientific and technological journal and patent activities. In the Scimago ranking Argentina is 39th out of 240 participating countries, and in the ranking of Scientific and Journal Activities it is 41st out of 197 countries.
Argentinian universities, such as Universidad de Buenos Aires, Buenos Aires Institute of Technology, and the Universidad Nacional del Comahue train specialists in various fields of energy, including Petroleum Engineering, Environmental Engineering, Environmental Management, etc. YPF SA, as well as companies such as Cefeidas Group are active in research in the field of unconventional oil. In the field of hydrocarbons from reservoirs with low-permeability the largest number of patents are owned by Levy Warren Michael and Sepp. S.R.L and Instituto Tecnologico de Buenos Aires, Pan American Energy as well as YPF SA conduct research in this field. Universidad Nacional del Sur, Universidad Tecnologia Nacional , Univerasidad de Buenos Aires, and Instituto Nacional de Technologia Agropecuaria conduct research in the field of biomass processing. Leading research universities in the field of solar energy are Universitad Naciobal de Salta and the Bariloche Atomic Center.
Ecology and Environment Protection
A diagram of environmental indices is shown in below. Figure 9 shows the indices that have an indirect effect on the energy sector, but have a significant impact on its future development. The country demonstrates a relatively high level of CO2 emissions in general, however, per capita the level is somewhat lower. Argentina is nevertheless regarded as one of the 60 countries responsible for more than 90% of global CO2 emissions related to energy in the Climate Change Performance Index (CCPI) 2022.
| Sources: 1. CO2 total emission by countries 2020 / European Commission / Joint Research Centre (JRC) / Emission Database for Global Atmospheric Research (EDGAR)*208 2. CO2 per capita emission 2020/European Commission/Joint Research Centre (JRC) / Emission Database for Global Atmospheric Research (EDGAR) *208 3. Forest area 2020 (% of land area) / The Global Forest Resources Assessment 2020 / Food and Agriculture Organization of the United Nations *234 4. Forest area change 2010-2020 (1000 ha/year) / The Global Forest Resources Assessment 2020 / Food and Agriculture Organization of the United Nations *234 5. The Environmental Performance Index (EPI) 2020 / Rankings / Yale Center for Environmental Law & Policy / Yale University *180 6. Annual freshwater withdrawals (m3 per capita), 2017 *179 Annual freshwater withdrawals, total (billion m3), 2017 – Food and Agriculture Organization, AQUASTAT data. /License: CC BY-4.0; Population – United Nations, Department of Economic and Social Affairs, Population Division (2019). World Population Prospects 2019, custom data acquired via website. Retrieved 15 November 2021 7. The National Footprint Accounts 2017 (Biocapacity Credit / Deficit) / Global Footprint Network *188 8. Methane emissions (kt of CO2 equivalent), 2018 / Data for up to 1990 are sourced from Carbon Dioxide Information Analysis Center, Environmental Sciences Division, Oak Ridge National Laboratory, Tennessee, United States. Data from 1990 are CAIT data: Climate Watch. 2020. GHG Emissions. Washington, DC: World Resources Institute. Available at: License : Attribution-NonCommercial 4.0 International (CC BY-NC 4.0) *191 9. The Climate Change Performance Index (CCPI) 2022 / Overall Results / Jan Burck, Thea Uhlich, Christoph Bals, Niklas Höhne, Leonardo Nascimento / Germanwatch, NewClimate Institute & Climate Action Network *60 * Total number of countries participating in ranking Figure 9. Environmental indices of Argentina |
There is a very negative trend in forest area change. In this ranking the country is 178th of 234 countries surveyed, behind Brazil. The situation is brightened, however, by a relatively high valuation of Argentina in the Environmental Performance Index rankings 2020 (EPI), which focuses primarily on assessing the environmental performance of national governments. Here, Argentina is 54th, below Mexico, but shows a positive trend.
Argentina also belongs to a group of countries with very high levels of methane emissions. The overall negative picture is moderated by the Ecological Footprint Atlas rating, according to which Argentina refers to the number of ecological creditors.
References
[1] List of sovereign states and dependencies by area / Wikipedia / en.wikipedia.org/wiki/List_of_sovereign_states_and_dependencies_by_area
[2] List of countries and dependencies by population density / Wikipedia / en.wikipedia.org/wiki/List_of_countries_and_dependencies_by_population_density
[3] Argentina / The world factbook / Library / Central Intelligence Agency / www.cia.gov
[4] GDP, PPP (constant 2011 international $) / World Bank, International Comparison Program database. License : CC BY-4.0 / Data / The World Bank / www.worldbank.org
[5] GDP per capita, PPP (current international $)/ World Bank, International Comparison Program database .License : CC BY-4.0 / Data / The World Bank / www.worldbank.org
[6] BP Statistical Review of World Energy 2021 (PDF) / BP / www.bp.com
[7] Síntesis de la evolución de Reservas de hidrocarburos Al 31 de diciembre de cada año Hasta el final de la vida útil de los yacimientos Período 2008-2017 (PDF) / Argentina.gob.ar / www.energia.gob.ar
[8] World Shale Resource Assessments / U.S. Energy Information Administration (September 24, 2015) / www.eia.gov
[9] Technically Recoverable Shale Oil and Shale Gas Resources: An Assessment of 137 Shale Formations in 41 Countries Outside the United States / U.S. Energy Information Administration (June 2013 ) / www.eia.gov
[10] 2010 Survey of Energy Resources (PDF) / World Energy Council / www.worldenergy.org
[11] Coal / 2013 Survey of Energy Resources (PDF) / World Energy Council / www.worldenergy.org
[12] Solar resource data obtained from the Global Solar Atlas, owned by the World Bank Group and provided by Solargis / Global Solar Athlas / globalsolaratlas.info
[13] Wind Map / Global Wind Atlas 2.0, a free, web-based application developed, owned and operated by the Technical University of Denmark (DTU) in partnership with the World Bank Group, utilizing data provided by Vortex, with funding provided by the Energy Sector Management Assistance Program (ESMAP). For additional information: globalwindatlas.info
[14] Agricultural land (% of land area) / Food and Agriculture Organization, electronic files and web site . License : CC BY-4.0 / Data / The World Bank / www.worldbank.org
[15] Forest area (% of land area) /Food and Agriculture Organization, electronic files and web site .License : CC BY-4.0 / Data / The World Bank / www.worldbank.org
[16] List of rivers of Argentina / Wikipedia / en.wikipedia.org/wiki/List_of_rivers_of_Argentina
[17] Hydropower / 2013 Survey of Energy Resources (PDF) / World Energy Council / www.worldenergy.org
[18] Wave power / Wikipedia / en.wikipedia.org/wiki/Wave_power
[19] World Bank What a Waste / Data / The World Bank / www.worldbank.org
[20] Argentina / Geography / U.S. Energy Information Administration / www.eia.gov/beta/international/
[21] International Energy Statistic / Geography / U.S. Energy Information Administration / www.eia.gov/beta/international/
[22] Cerro Dragon Oil Field / A Barell Full / abarrelfull.wikidot.com
[23] Javier Gomez. Cerro Dragon: History and Future Challenges for an Integrally Managed Field. (June 30, 2015) / Google / www.google.com
[24] Carin and Aries Gas Field / A Barell Full / abarrelfull.wikidot.com
[25] List of oil refineries / Wikipedia / en.wikipedia.org/wiki/List_of_oil_refineries
[26] Puerto Rosales / Argentina / Oil Storage / Terminals / Oiltanking / www.oiltanking.com
[27] Conceptos Sobre Hidrocarburos by Secretaria de Energia Republica Argentina (2003) (PDF) / Ministerio de Energia y Mineria del Argetina / www.minem.gob.ar
[28] Bahia Blanca GasPort / Escpbar / Excelerate Energy L.P. / excelerateenergy.com
[29] Coal in Argentina / Argentina / Latin America & The Caribbean / The World Energy Council / www.worldenergy.org
[30] Kraftwerk Costanera / Wikipedia / de.wikipedia.org/wiki/Kraftwerk_Costanera
[31] Power Generation ServicesOrlando, Florida Siemens to provide long-term service at two power plants in Argentina / 15 May 2017 / Siemens / press.siemens.com
[32] Rio Turbio power Station / Source Watch / www.sourcewatch.org
[33] Kernkraftwerk Atucha / Wikipedia / de.wikipedia.org/wiki/Kernkraftwerk_Atucha
[34] Yacyretá Dam / Wikipedia / en.wikipedia.org/wiki/Yacyret%C3%A1_Dam
[35] El ingenio La Florida invirtio U$S 49 millones para cogenerar / 10 June 2012 / La Gaceta / www.lagaceta.com.ar
[36] Generamos energia electrica para mil hogares a partir del biogas de la basura / CEAMSE / www.ceamse.gov.ar
[37] INFORMES DE CADENAS DE VALOR (PDF) / AÑO 1 - N° 3 – Julio 2016 / Azúcar / www.economia.gob.ar
[38] Bolsa de Comercio de Rosario / www.bcr.com.ar
[39] Parque solar fotovoltaico Canada Honda / Energias de mi Pais | Recursos energeticos de Argentina / energiasdemipais.educ.ar
[40] CFK opens Argentina’s largest wind farm in Patagonia: 80 MW / MercoPress / en.mercopress.com
[41] Hydrogen Plant / HYCHIC / www.hychico.com.ar
[42] Compania Administratora del Mercado Mayorista Electrico SA / Annuario 2016 / Ministeria de Energia y Mineria / www.minem.gob.ar
[43] Energias Renovables Nuevo Marco Regulatorio y Perspectivas 2016 (PDF) / Ministeria de Energia y Mineria / www.minem.gob.ar
The sources of charts and curves are specified under the images.
For more information about the energy industry in Argentina see here