
Contents
General State of the Economy
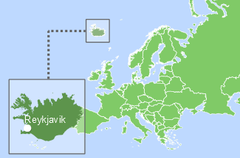
Iceland, officially the Republic of Iceland, is a Nordic island country, located in the North Atlantic Ocean and in the Arctic Ocean between Greenland, Norway, the British Isles, and the Faroe Islands.
According to 2023 statistics, Iceland, which ranks 108th in the world in terms of the size of its territory, is home to around 361 thousand people. In terms of population density, the country occupies the 240th place in the world being one of the least densely populated countries on the globe. The length of the country’s coastline is 4,970 km. Reykjavik is the capital and largest city, with half the population living in and around it. Iceland is a unitary parliamentary republic. The country is divided into 64 municipalities [1,2,3,4,5].
| Republic of Iceland | ||
|---|---|---|
| Capital: Reykjavík | Density: 3.66/km2 | Currency: Icelandic króna (ISK) |
| Official languages: Icelandic | Life expectancy at birth: 83.07 years | GDP (PPP): $27.078 billion (2023 est.) |
| National Day: 17 June | Area (land): 102,775 km2 | GDP - per capita (PPP): $69,833 (2023 est.) |
| Population: 376,248 (2022 est.) | Coastline: 4,970 km | Internet country code: .is |
Source: [1,2,3,4,5]

Reykjavik
The rating positions of Iceland relative to other countries have been determined for an extensive list of economic, energy, innovative and educational indices, as well as for metrics reflecting the state of the environment. The economic indices include, for example, GDP per capita, annual average GDP growth, high-technology exports, and others. The list of energy indices includes proven reserves of oil, gas and coal, production-consumption ratio combined, and energy use, etc. Each of the indices has a ranked list of included member countries. Since the number of countries in each rating is different for each index, the positioning of the country of interest is displayed on a special chart, where the vertical axis is a uniform relative scale from 0 to 1, whereas the horizontal axis denominates the various indices and respective numbers relating to the descriptions given underneath.
Thus, in such a relative “0-1” diagram, the country’s position is marked with a dot in proportion to its location in the original rating list. If the country is among the leaders regarding the selected indicator, it will be marked close to 1 in the upper green zone on the relevant chart “0-1”, if the country is an outsider in the rating list, then it will be marked in the lower red zone of the chart “0-1”, etc.
Ranking position of Iceland for list of economic indices:
| Sources: 1. GDP (purchasing power parity), 2020 est. / The World Factbook/Library/Central Intelligence Agency *228 2. GDP - per capita (PPP), 2020 / The World Factbook/Library/Central Intelligence Agency *229 3. Inflation rate (consumer prices), 2019 est. / The World Factbook/Library/Central Intelligence Agency *228 4. Charges for the use of intellectual property, receipts (BoP, current US$), 2020 / International Monetary Fund, Balance of Payments Statistics Yearbook, and data files. / License: CC BY-4.0 *88 5. The Global Competitiveness Index 2019 / Rankings / Reports / World Economic Forum *141 6. High-technology exports (current US$) 2019-2020 / United Nations, Comtrade database through the WITS platform / License: CCBY-4.0 / Data *134 7. 2021 Index of Economic Freedom / International Economies / The Heritage Foundation *178 8. Reserves of foreign exchange and gold, 2017 est. / The World Factbook / Library / Central Intelligence Agency *195 9. Annual average GDP growth in %, for the last 10 years (2011-2020) / World Bank national accounts data, and OECD National Accounts data files / License: CC BY-4.0 *206 10. Public debt (% of GDP), 2017 est. / The World Factbook / Library / Central Intelligence Agency (from smallest to largest) *210 * Total number of countries participating in ranking Figure 1. Economic Indices of Iceland |
For most of the economic indicators shown in the chart, Iceland is above the middle of the ranking lists. The weakest spots in Iceland economic indicators are GDP (0.33), Inflation rate (0.36) and High-technology exports (0.46). Iceland has the best indices among those presented for 2021 Index of Economic Freedom (0.94), GDP per capita (0.90) and The Global Competitiveness Index (0.82).
Energy Resources
Iceland has no significant fossil fuel reserves and imports 100% of its oil and coal. Iceland's energy mix is free of natural gas.
The country meets about 85% of its primary energy needs from renewables, namely hydropower and geothermal power. Moreover, Iceland generates almost 100% of its electricity from these two renewable sources (Fig.5).
Iceland has favorable conditions for the development of wind power. In a number of regions of the country, especially on the coast, wind speed reaches 9.5 m/s at a height of 50 m. Due to the high latitude, Iceland has relatively low GHI intensity, which means limited solar power potential.
The main energy resource of Iceland is hydroelectric and geothermal energy. The country has an enormous hydro’s gross theoretical potential of 184 TWh/year. The most powerful hydro-based power plants are located in the southwest of the country in the area of glacial rivers Thjórsá and Tungnaá, while multiple smaller hydroelectric plants use the flow of Icelandic streams and rivers throughout the country.
In Iceland there are geothermal fields with high and low temperatures, which are distributed essentially all over the country. The geothermal potential of Iceland is estimated at 4300-7000 MWe. Geothermal power plants have two main areas of concentration – the first in the southwest of the country in the area surrounding the capital Reykjavik, the second in the North-east Iceland.
Table 1.Renewable energy resources of Iceland
| Resource/ Explanations | Solar Potential (GHI)* | Wind Potential (50 м)* | Bio Potential (agricultural area) | Bio Potential (forest area) | Hydro energy Potential** | Geothermal Potenial | Municipal Solid Waste |
|---|---|---|---|---|---|---|---|
| Value | no data | 6.5-9.5 | 18.6 | 0.5 | 184 000 | 4300-7000 | 704 |
| Unit | - | m/s | % of land area | % of land area | GWh/year | MWe | kg per capita |
| Year | - | 2020 | 2020 | 2020 | 2013 | 2016 | 2021 |
| Source | [-] | [6] | [7] | [8] | [9] | [10] | [11] |
*for most of the territory of the country
**gross theoretical capability
REYKJAVIK, Country: ICELAND, Latitude: 64.13, Longitude: -21.94
Sky cover, %
HVERAVELLIR, Country: ICELAND, Elevation: +0641.0m, Latitude: 64.87, Longitude: -19.57
Average speed: 7.43 m/s, Operational share: 84%
Wind speed, m/s

Iceland has an enormous hydro potential. The waterfall Gullfoss

Iceland has many geothermal fields. Geothermal geyser
Although the landscapes of Iceland are quite diverse, forests cover only about 0.5% of the country's territory. Due to the lack of forests and the small area of agricultural land (18.6%), there is little raw material for the development of bioenergy.
Energy Balance
According to [12], in 2022, the total production of primary energy in Iceland was 0.068 quadrillion Btu, while consumption was at the level of 0.115 quadrillion Btu. Thus, the share of domestic production in primary energy consumption was about 59.1%. This makes Iceland a country dependent on energy imports.
According to the Statistical Review of World Energy 2022 [13], primary energy consumption in Iceland in 2021 amounted to 0.21 exajoules. According to the Islandic National Energy Authority, in 2020 primary energy use was covered about 90% by renewable energy sources [14].
Source: U.S. Energy Information Administration (Mar 2024) / www.eia.gov
Figure 2. The production and consumption of fossil fuels in Iceland (coal – left, gas – in the center, oil – right)
As can be seen from the graph above, Iceland produces neither coal nor natural gas or oil. In addition, the country does not consume natural gas at all, while coal and oil play a relatively minor role. According to [14], the imported oil products are mostly used in transportation and fishing sectors.
The consumption of coal increased from about 94 thousand short tons in 2003 to 150 thousand short tons in 2022, while oil consumption remained at 20 thousand barrels per day for the same period.
Sources: U.S. Energy Information Administration (Mar 2024) / www.eia.gov | ||
| Figure 3. Electricity production in Iceland |
As already mentioned, today almost 100% of the electricity consumed in Iceland comes from renewable energy. Iceland's total electricity production in 2022 was 19.86 TWh, of which about 70% was produced by hydroelectric power plants and another 30% was distributed among other renewables, the lion's share of which is geothermal energy. Over the past 10 years, the amount of electricity consumed has grown insignificantly and is satisfied by domestic production.
The chart of Iceland's energy indices is presented in the figure below.
| Sources: 1. Crude oil proved reserves, 2021 / International Energy Statistic/Geography / U.S. Energy Information Administration (Nov 2021)*98 2. Natural gas proved reserves 2021 / International Energy Statistic / Geography / U.S. Energy Information Administration (Nov 2021) *99 3. Total recoverable coal reserves 2019 / International Energy Statistic / Geography / U.S. Energy Information Administration (Nov 2021) *81 4. Combination production-consumption for Crude oil 2018 / International Energy Statistic / Geography / U.S. Energy Information Administration (Nov 2021) *219 5. Combination production-consumption for Natural gas 2019 / International Energy Statistic / Geography / U.S. Energy Information Administration (Nov 2021) *123 6. Combination production-consumption for Coal 2019 / International Energy Statistic / Geography / U.S. Energy Information Administration (Nov 2021) *128 7. Electricity – from other renewable sources (% of total installed capacity), 2017 est. / The World Factbook / Library / Central Intelligence Agency *170 8. GDP per unit of energy use (PPP per unit of oil equivalent), 2020 *66 Primary energy consumption - BP Statistical Review of World Energy 2021/BP;GDP (purchasing power parity) - The World Factbook/Library/Central Intelligence Agency 9. Energy use (primary energy use of oil equivalent per capita) 2020 *127 Primary energy consumption – BP Statistical Review of World Energy 2021; Population - United Nations, Department of Economic and Social Affairs, Population Division (2019). World Population Prospects 2019, custom data acquired via website. Retrieved 15 November 2021*66 10. The Global Energy Architecture Performance Index Report (EAPI) 2017 / Rankings / Reports / World Economic Forum 11. Electric power consumption (kWh per capita), 2016 *217 Electricity Consumption - The World Factbook / Library / Central Intelligence Agency; Population - United Nations, Department of Economic and Social Affairs, Population Division (2019). World Population Prospects 2019, custom data acquired via website. Retrieved 15 November 2021 12. Combination of electricity production-consumption (kWh)/The World Factbook/Library/Central Intelligence Agency *216 * Total number of countries participating in ranking Figure 4. Energy indices of Iceland |
Since Iceland has no significant fossil fuel reserves, the country's positions in crude oil, natural gas, and coal reserves remain blank in the chart above. This also applies to the Combined Production-Consumption of natural gas, as this fuel is missing in the country's energy mix. In addition, Iceland logically has a relatively low ratio of the Combined Production-consumption of oil (0.45). The fact that renewable energy is the main contributor to the country's electricity production is reflected in Iceland's position in Electricity – from other renewable sources (0.84). The strongest indicators reflected on the graph are Energy use per capita (0.99) and Electric power consumption per capita (1.00). Apart from that, the country is well-positioned in the Global Energy Architecture Performance Index (0.80).
Energy Infrastructure


Írafossstod Power Station, 48 MW
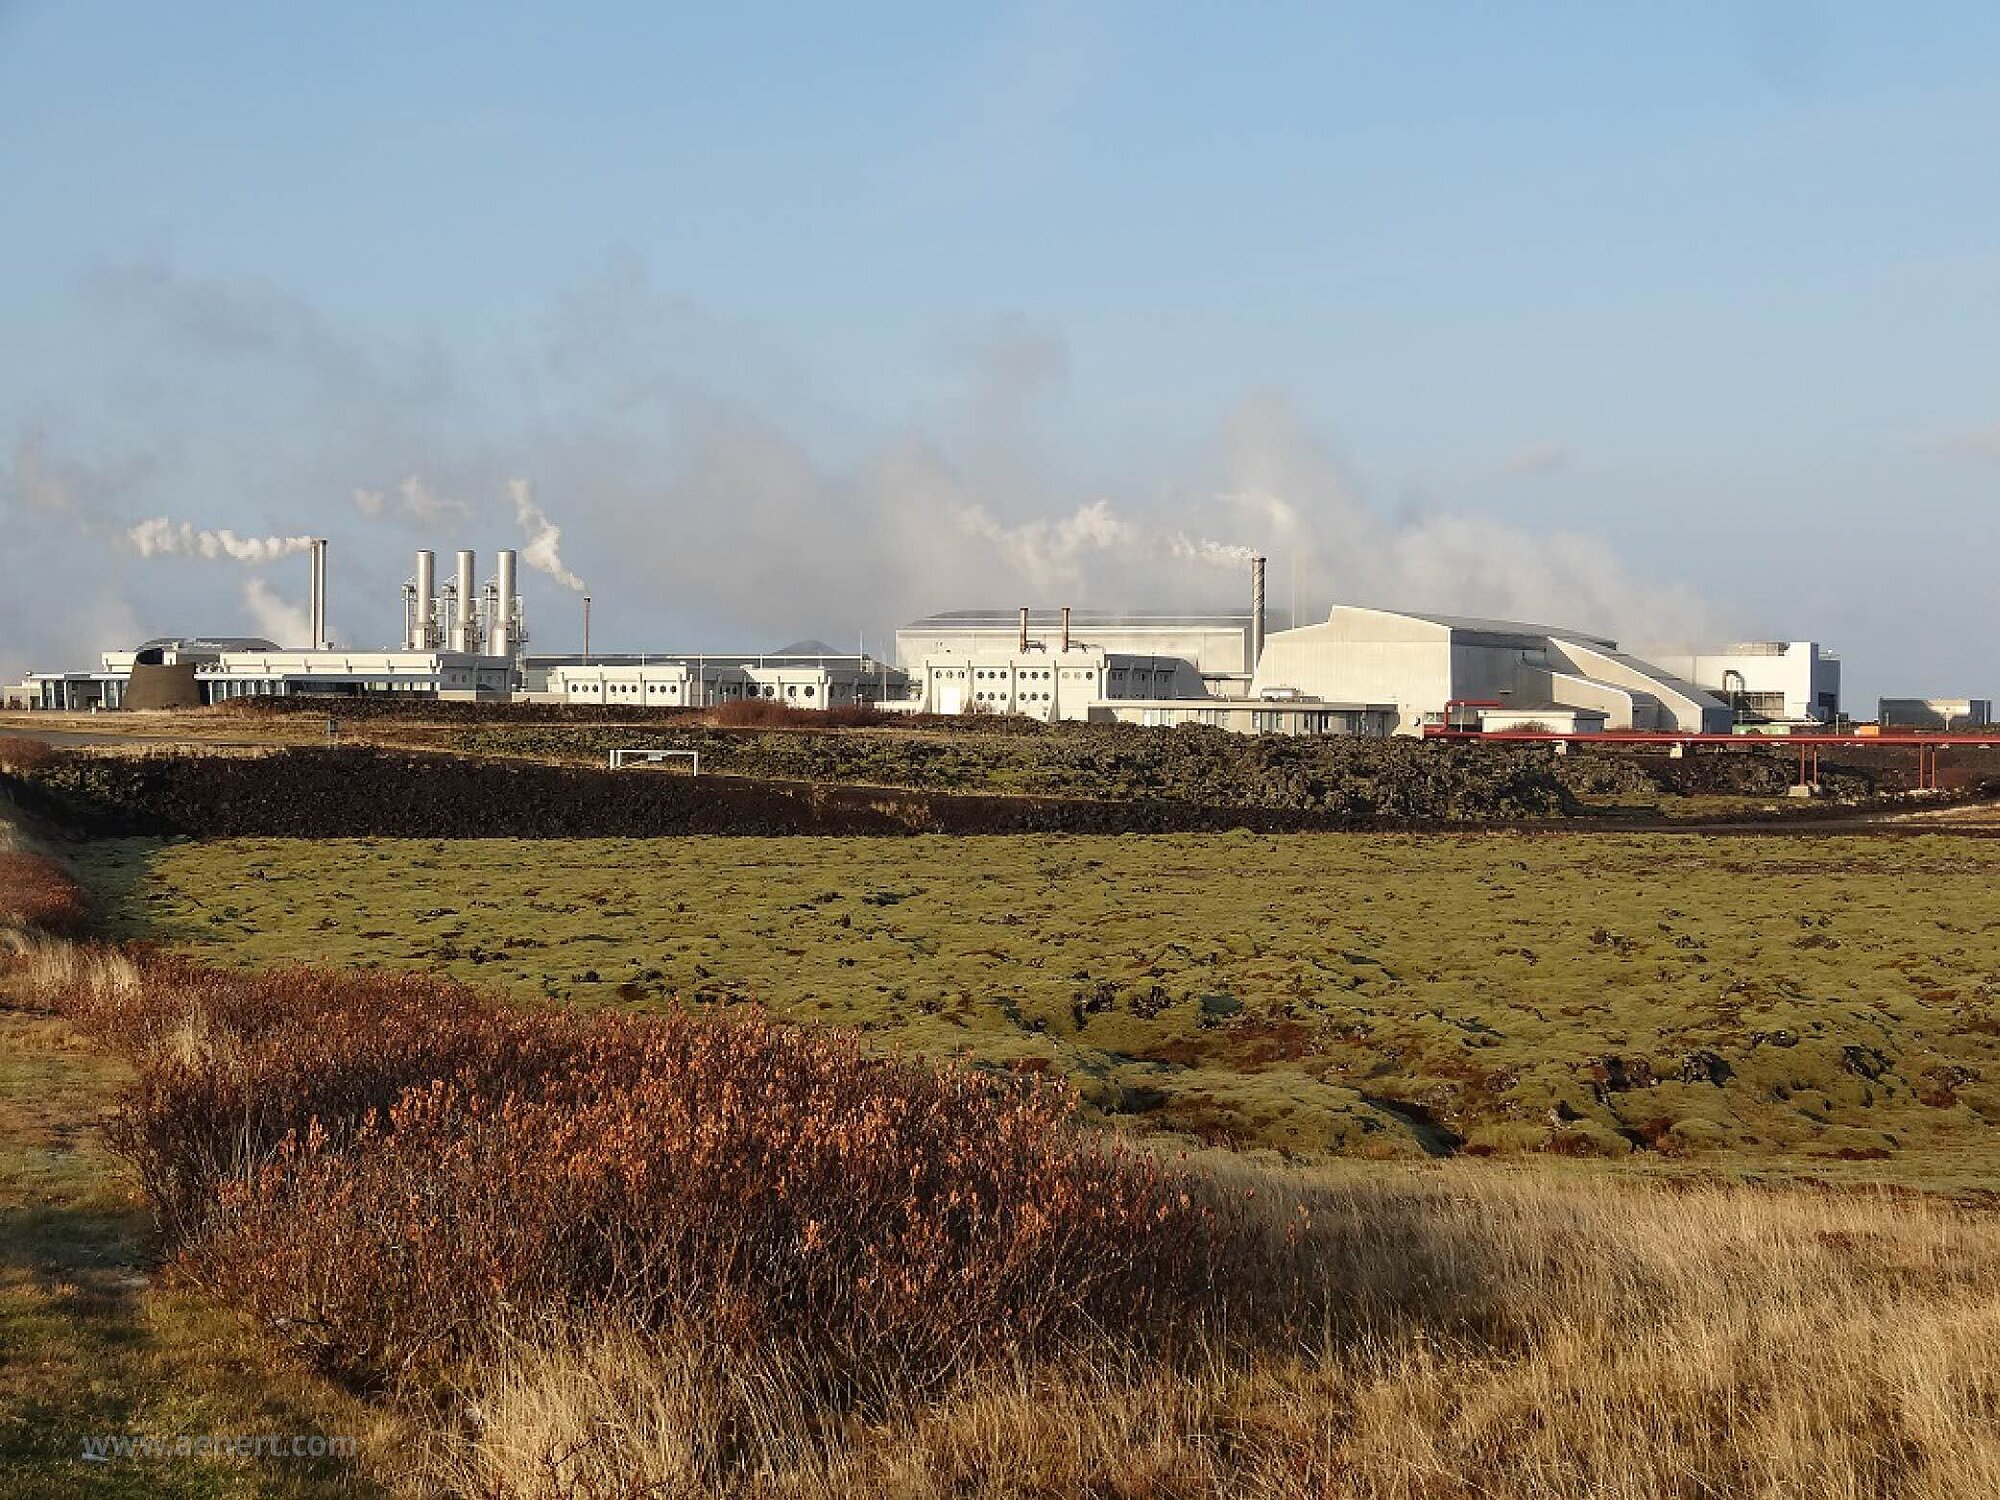
Iceland has various types of geothermal power plants. The flash steam combined heat and power station Hellisheiði is the largest geothermal electricity generation plant in Iceland the third largest in the world. It has a total output of 303,4 MW [14].

Nesjavellir Geothermal Power Station, 120 MWe
Starting from 2013, a small contribution to electricity production in Iceland comes from wind power. The first large wind turbines are located in in the area of upper Thjorsa river in the south of Iceland [14].
The Svartsengi Power Station, 74.4 MW
The government of Iceland has developed and presented an Energy Policy to 2050, planning to add new and diverse energy options and completely replace fossil fuels with renewables. To achieve these goals, it is planned to develop wind and solar energy, as well as hydrogen and methane [15].
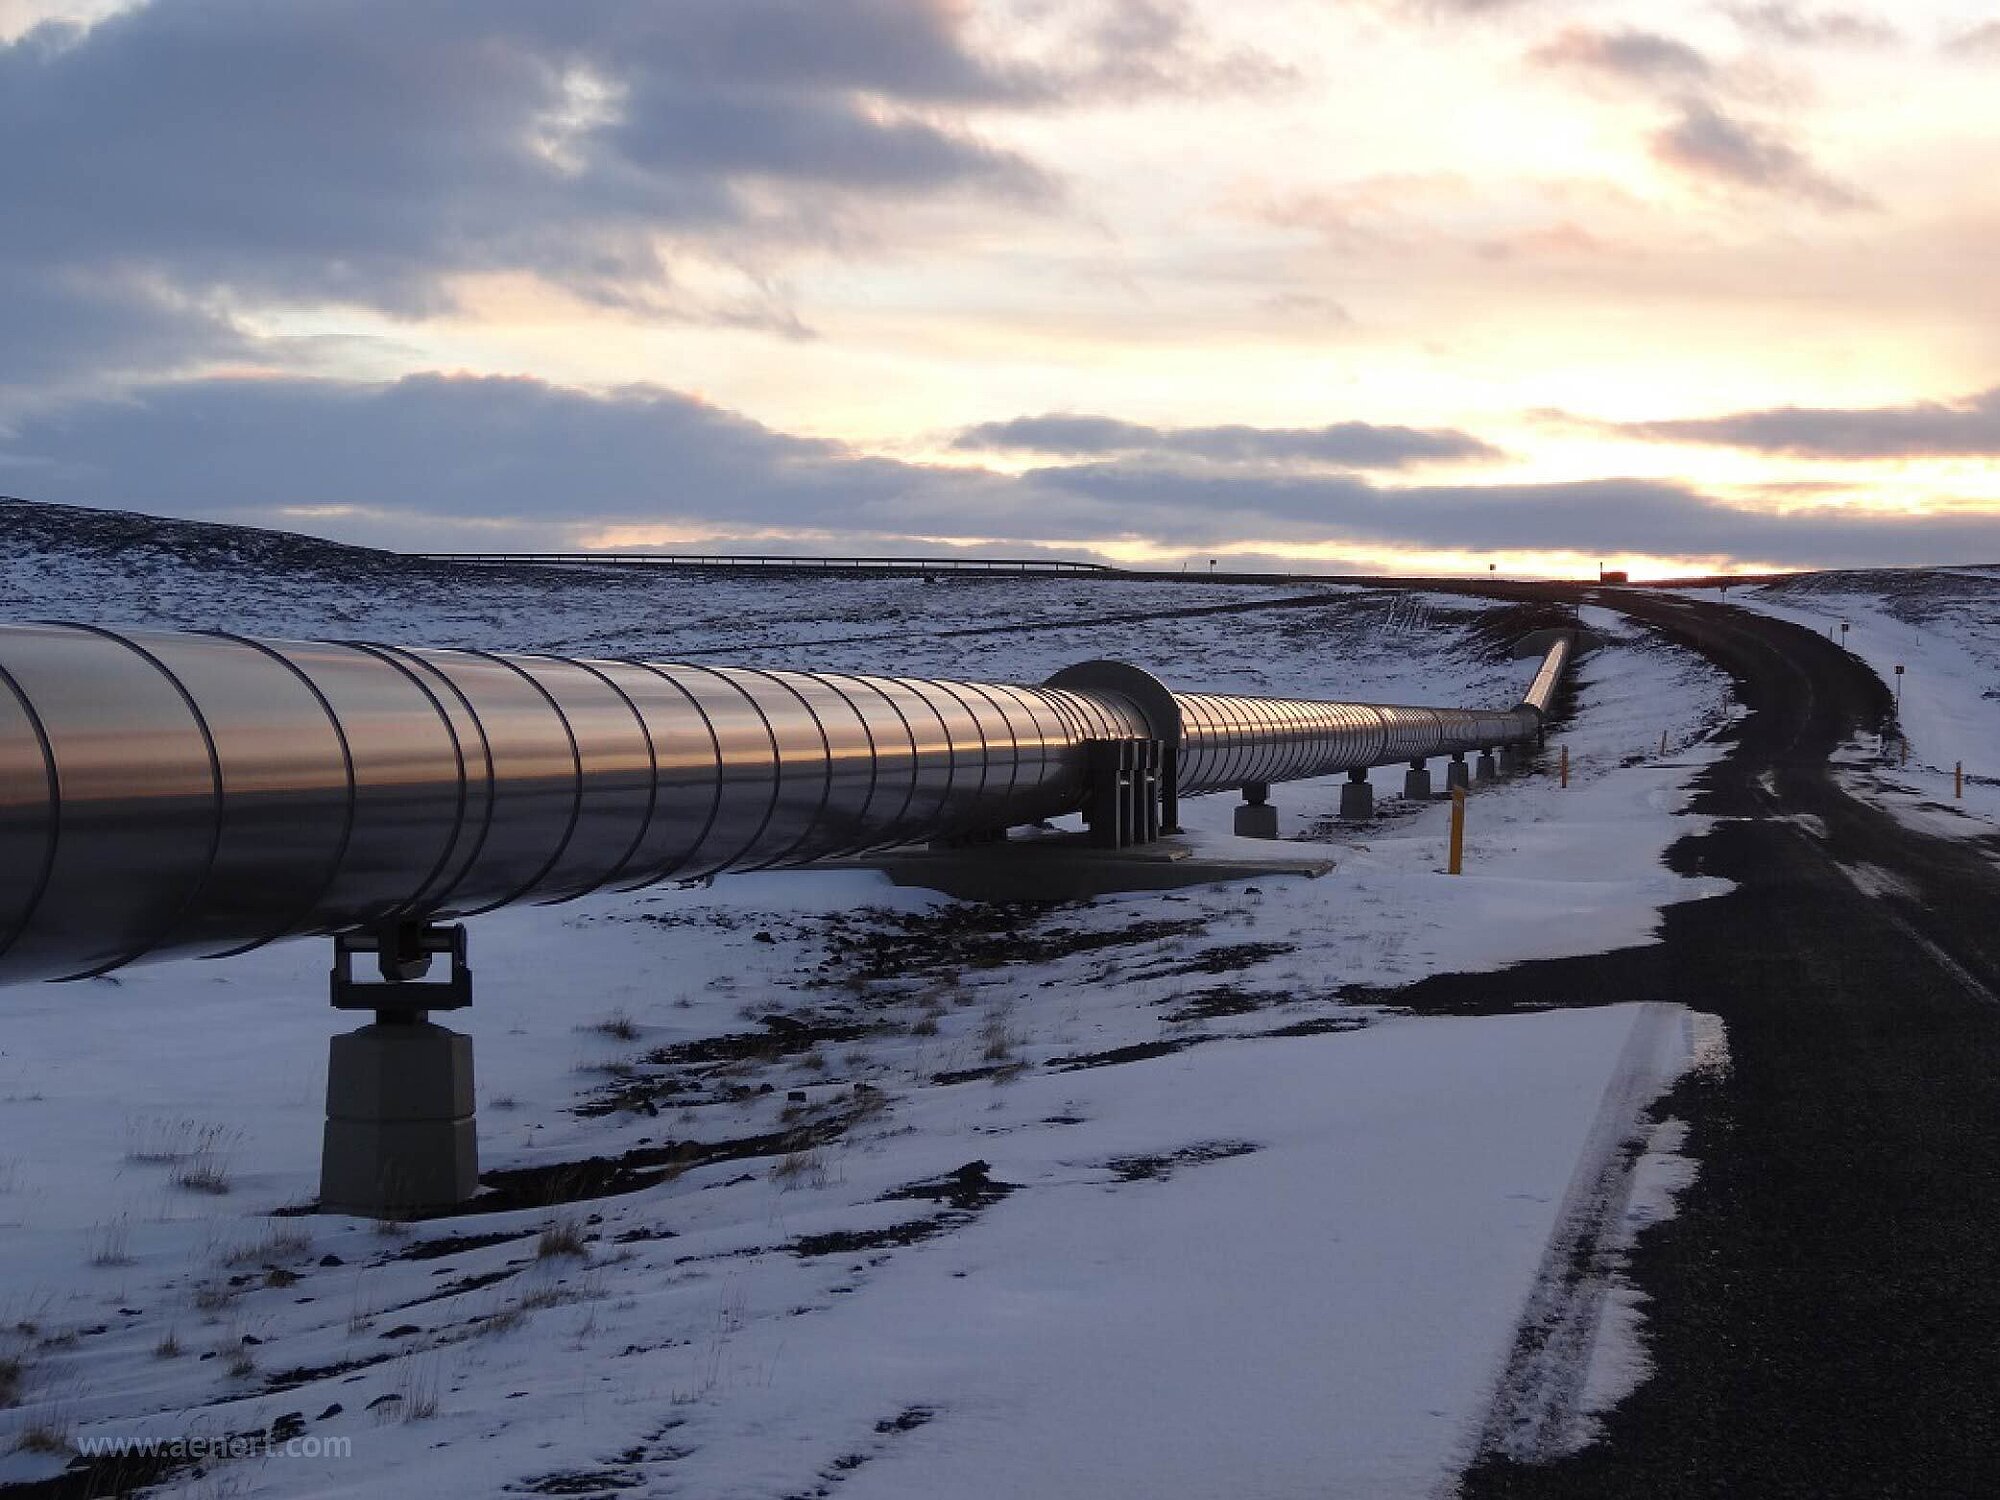
Endless pipelines with hot water and steam
Education and Innovation
The following chart shows Iceland's positions in terms of education and innovation:
Sources: 1. The Global Innovation Index 2021, Rankings / Knowledge / World Intellectual Property Organization / Cornell University, INSEAD, and WIPO (2021): Energizing the World with Innovation. Ithaca, Fontainebleau, and Geneva *132 2. Patent Grants 2011-2020, resident & abroad / Statistical country profiles / World Intellectual Property Organization *185 3.Patents in Force 2020 / Statistical country profiles / World Intellectual Property Organization *109 4. QS World University Rankings 2022 *97 5. SCImago Country Rankings (1996-2020) / Country rankings / SCImago, (n.d.). SIR-SCImago Journal & Country Rank [Portal]. Retrieved 17 Nov 2021 *240 6. Internet users in 2018 / The World Factbook / Central Intelligence Agency *229 7. Internet users in 2018 (% Population) / The World Factbook / Central Intelligence Agency *229 8. Government expenditure on education, total (% of GDP), 2019 / United Nations Educational, Scientific, and Cultural Organization (UNESCO) Institute for Statistics. License: CCBY-4.0 / Data as of September 2021*177 9. Research and development expenditure (% of GDP), 2018 / UNESCO Institute for Statistics. License: CCBY-4.0 / Data *119 10. Scientific and technical journal articles, 2018 / National Science Foundation, Science and Engineering Indicators. License: CCBY-4.0 / Data *197 * Total number of countries participating in ranking | ||
| Figure 6. The indices of education and innovation in Iceland |
Iceland has a fairly high share of internet users relative to the total number of its population (0.98). The indicator of the absolute number of Internet users is well below the global average (0.29), which is due to the small population of the country. Iceland is very well positioned in terms of Government expenditure on education (0.93) and Research and development expenditure (0.88), as well as in The Global Innovation Index Ranking (0.87). No Icelandic university is included in the QS World University Rankings 2022, leaving this indicator blank.
Ecology and Environment Protection
Indicators related to environmental issues are presented in the following diagram:
| Sources: 1. CO2 total emission by countries 2020 / European Commission / Joint Research Centre (JRC) / Emission Database for Global Atmospheric Research (EDGAR)*208 2. CO2 per capita emission 2020/European Commission/Joint Research Centre (JRC) / Emission Database for Global Atmospheric Research (EDGAR) *208 3. Forest area 2020 (% of land area) / The Global Forest Resources Assessment 2020 / Food and Agriculture Organization of the United Nations *234 4. Forest area change 2010-2020 (1000 ha/year) / The Global Forest Resources Assessment 2020 / Food and Agriculture Organization of the United Nations *234 5. The Environmental Performance Index (EPI) 2020 / Rankings / Yale Center for Environmental Law & Policy / Yale University *180 6. Annual freshwater withdrawals (m3 per capita), 2017 *179 Annual freshwater withdrawals, total (billion m3), 2017 – Food and Agriculture Organization, AQUASTAT data. /License: CC BY-4.0; Population – United Nations, Department of Economic and Social Affairs, Population Division (2019). World Population Prospects 2019, custom data acquired via website. Retrieved 15 November 2021 7. The National Footprint Accounts 2017 (Biocapacity Credit / Deficit) / Global Footprint Network *188 8. Methane emissions (kt of CO2 equivalent), 2018 / Data for up to 1990 are sourced from Carbon Dioxide Information Analysis Center, Environmental Sciences Division, Oak Ridge National Laboratory, Tennessee, United States. Data from 1990 are CAIT data: Climate Watch. 2020. GHG Emissions. Washington, DC: World Resources Institute. Available at: License : Attribution-NonCommercial 4.0 International (CC BY-NC 4.0) *191 9. The Climate Change Performance Index (CCPI) 2022 / Overall Results / Jan Burck, Thea Uhlich, Christoph Bals, Niklas Höhne, Leonardo Nascimento / Germanwatch, NewClimate Institute & Climate Action Network *60 * Total number of countries participating in ranking | ||
| Figure7. Environmental Indices of Iceland |
The fact that all electricity production comes from hydro and geothermal energy is positively reflected in the Environmental Indices chart. For example, Iceland is well positioned in the 2020 Environmental Performance Index (0.91) and in Annual freshwater withdrawals (0.85).
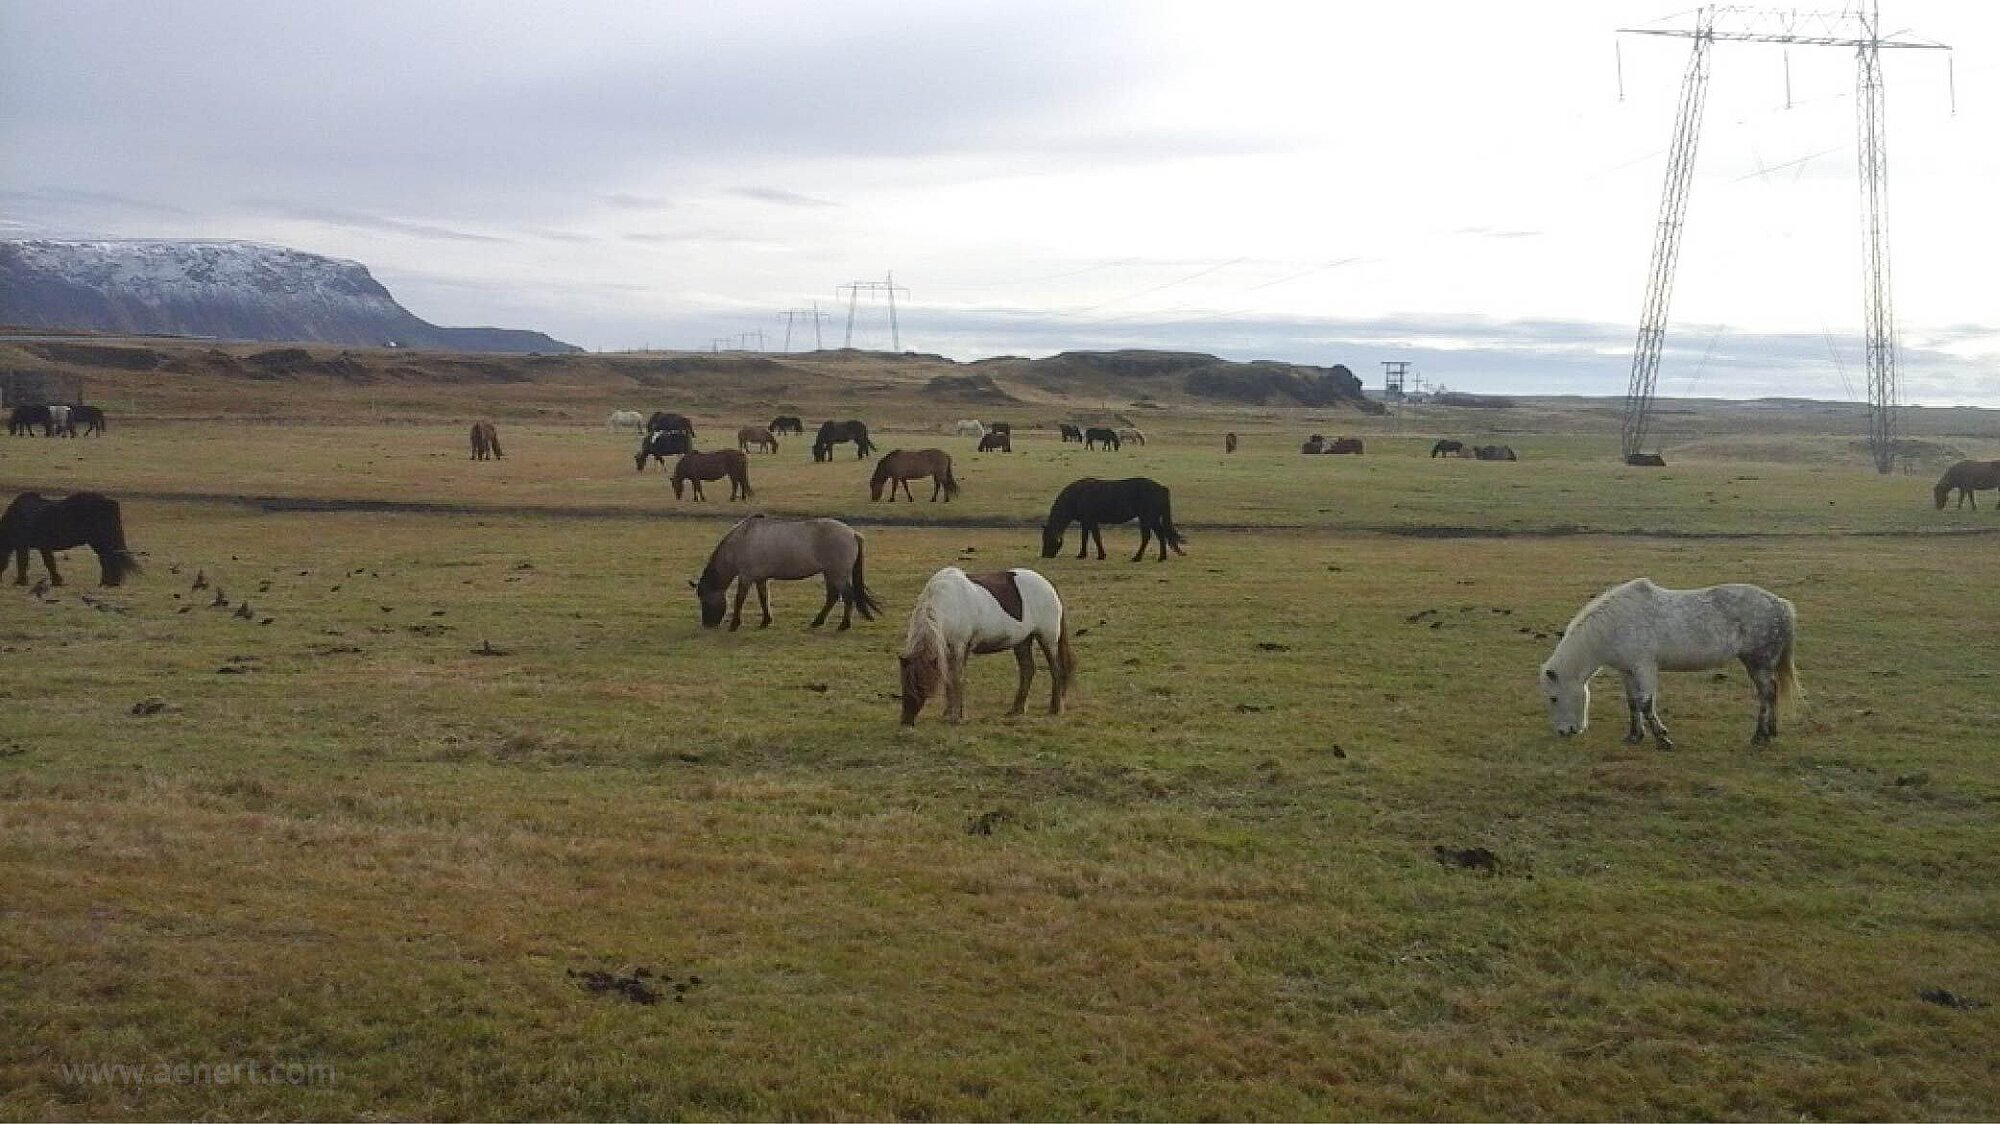
Icelandic horses
The country is not represented in The National Footprint Accounts and in The Climate Change Performance Index (CCPI). Due to the lack of forests, Iceland has a very weak position in this indicator (0.07), but there is a positive trend concerning the change in the area of forests (0.73).
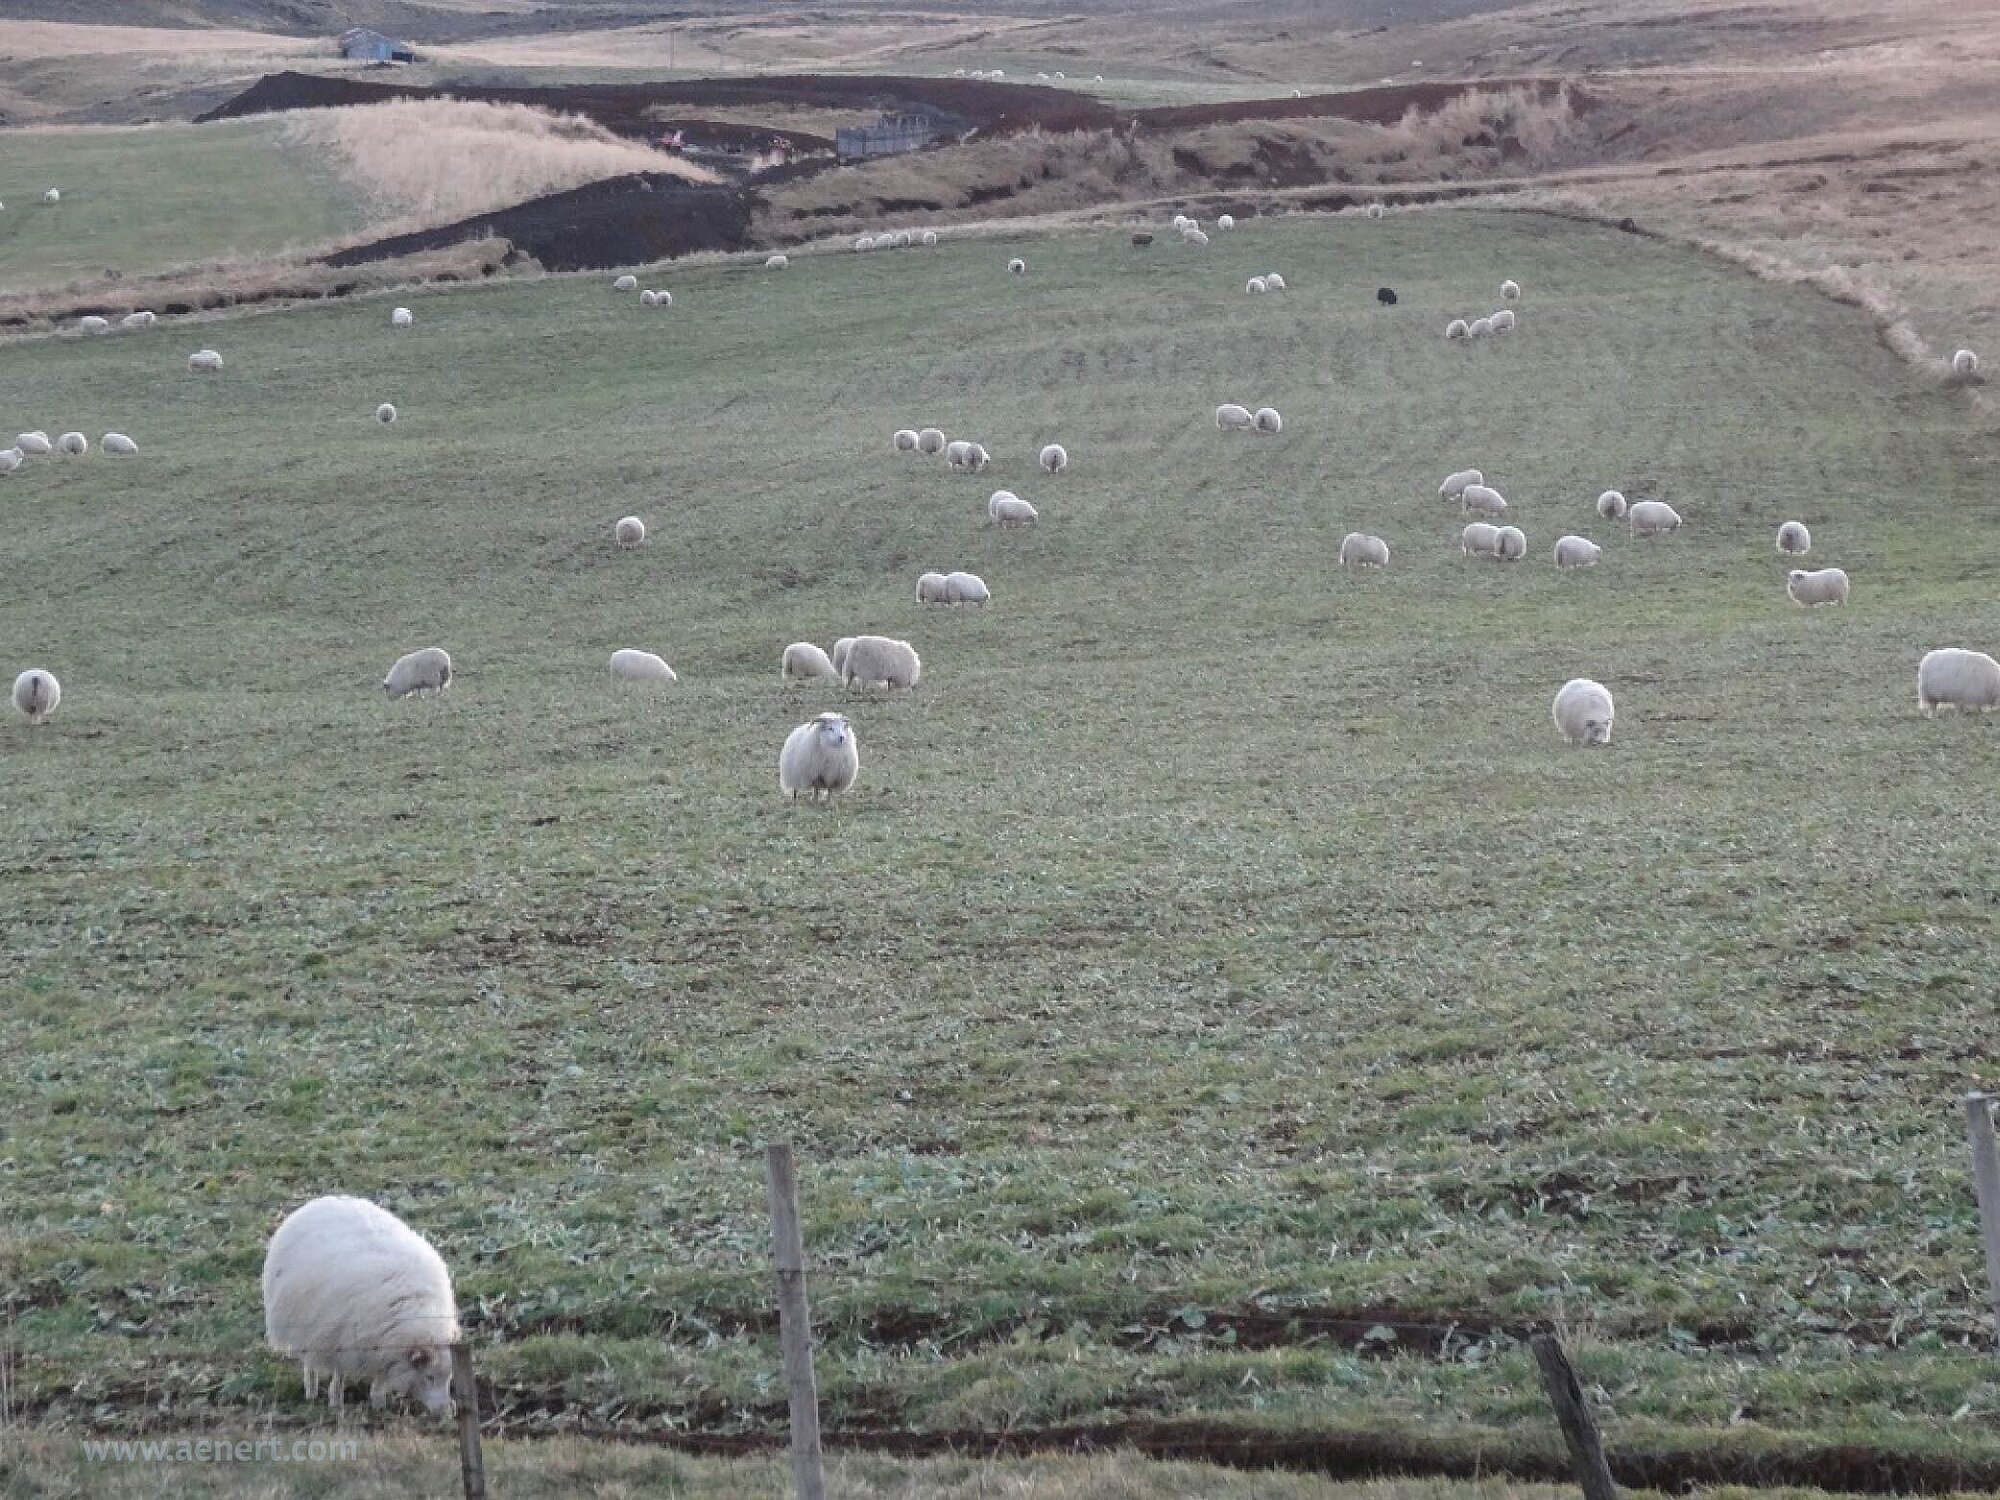
Icelandic sheep
References
[1] List of sovereign states and dependencies by area / Wikipedia / en.wikipedia.org/wiki/List_of_sovereign_states_and_dependencies_by_area
[2] List of countries and dependencies by population density / Wikipedia / en.wikipedia.org/wiki/List_of_countries_and_dependencies_by_population_density
[3] Iceland / The world factbook / Library / Central Intelligence Agency / www.cia.gov
[4] GDP, PPP (constant 2011 international $) / World Bank, International Comparison Program database. License: CC BY-4.0 / Data / The World Bank / www.worldbank.org
[5] GDP per capita, PPP (current international $) / World Bank, International Comparison Program database. License: CC BY-4.0 / Data / The World Bank / www.worldbank.org
[6] Wind Map / Global Wind Atlas 2.0, a free, web-based application developed, owned and operated by the Technical University of Denmark (DTU) in partnership with the World Bank Group, utilizing data provided by Vortex, with funding provided by the Energy Sector Management Assistance Program (ESMAP). For additional information: globalwindatlas.info
[7] Agricultural land (% of land area) /Food and Agriculture Organization, electronic files and web site. License: CC BY-4.0 / Data / The World Bank / www.worldbank.org
[8] Forest area (% of land area) /Food and Agriculture Organization, electronic files and web site. License: CC BY-4.0 / Data / The World Bank / www.worldbank.org/[16] World Energy Resources: Hydro World Energy Council / 2013 / Publications / World Energy Council / www.worldenergy.org
[9] World Energy Resources: Hydro World Energy Council / 2013 / Publications / World Energy Council / www.worldenergy.org
[10] 2016 Annual U.S. & Global Geothermal Power Production Report (PDF) / 2016 / Reports / Geothermal Energy Association / geoenergy.org
[11] Municipal waste statistics Updated / 19 July 2018 / Full list / Statistics Explained / Eurostat / ec.europa.eu
[12] International Energy Statistic / Geography / U.S. Energy Information Administration (Dec 2022) / www.eia.gov/beta/international/
[13] BP Statistical Review of World Energy 2020-2022 (PDF) / BP / www.bp.com
[14] Energy Data / National Energy Authority ORKUSTOFNUN / nea.is/the-national-energy-authority/energy-data/
[15] A Sustainable Energy Future. An Energy Policy to the year 2050 / Government of Iceland / www.stjornarradid.is/library/01--Frettatengt---myndir-og-skrar/ANR/Orkustefna/201127%20Atvinnuvegaraduneytid%20Orkustefna%20A4%20EN%20V4.pdf
The sources of charts and curves are specified under the images.
For more information about the energy industry in Iceland see here