
Contents
General State of the Economy
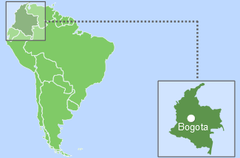
Colombia, officially the Republic of Colombia is one of the most economically stable countries in Latin America and is located in South America between Brazil and Venezuela (in the east), Ecuador and Peru (in the south), and borders Panama in the west. According to 2022 statistics, Colombia, which in terms of size is placed 27th in the world, is home to around 49 million people. In terms of population density, the country is 175th in the world [1,2,3]. The total length of the country's coastline is 3 208 km [3].
| Colombia/República de Colombia | ||
|---|---|---|
| Capital: Bogotá | Density: 42.23/km2 | Currency: Peso (COP) |
| Official languages: Spanish | Life expectancy at birth: 74.77 years | GDP (PPP): $1.014 trillion (2023 est.) |
| National Day: 20 July | Area: 1,141,748 km2 | GDP - per capita (PPP): $19,460 (2023 est.) |
| Population: 49,336,454 (2023 est.) | Coastline: 3,208 km | Internet country code: .co |
Source: [1,2,3,4,5]
Colombia is the only South American country that has access to both the Atlantic and Pacific Oceans [3]. The administrative map of Colombia is divided into 32 departments, and the official language is Spanish. Most of the population is settled in the north and east of the country, next to agricultural areas and where natural resources have been discovered [3].
| Sources: 1. GDP (purchasing power parity), 2020 est. / The World Factbook/Library/Central Intelligence Agency *228 2. GDP - per capita (PPP), 2020 / The World Factbook/Library/Central Intelligence Agency *229 3. Inflation rate (consumer prices), 2019 est. / The World Factbook/Library/Central Intelligence Agency *228 4. Charges for the use of intellectual property, receipts (BoP, current US$), 2020 / International Monetary Fund, Balance of Payments Statistics Yearbook, and data files. / License: CC BY-4.0 *88 5. The Global Competitiveness Index 2019 / Rankings / Reports / World Economic Forum *141 6. High-technology exports (current US$) 2019-2020 / United Nations, Comtrade database through the WITS platform / License: CCBY-4.0 / Data *134 7. 2021 Index of Economic Freedom / International Economies / The Heritage Foundation *178 8. Reserves of foreign exchange and gold, 2017 est. / The World Factbook / Library / Central Intelligence Agency *195 9. Annual average GDP growth in %, for the last 10 years (2011-2020) / World Bank national accounts data, and OECD National Accounts data files / License: CC BY-4.0 *206 10. Public debt (% of GDP), 2017 est. / The World Factbook / Library / Central Intelligence Agency (from smallest to largest) *210 * Total number of countries participating in ranking Figure 1. Economic Indices of Brazil |
Colombia's economy is mainly focused on the export of energy resources and agricultural products. The level of development of the Colombian economy is reflected in the comparative diagram of various economic indices - Fig.1. In almost all cases, Colombia is placed at the upper part of the diagram. The only exception is the inflation rate, which changed from 7.5% in 2016 to 4.3% in 2017, and to 3.5% in 2019 [3]. Since the early 1990s, the country has experienced a steady growth in GDP at purchasing power parity, both in general and per capita [4,5]. However, GDP at purchasing power parity decreased from $711.6 billion (31st in the world) in 2017 to $683.9 in 2020 (32nd in the world)[3]. The country’s GDP at purchasing power parity per capita is lower (114th in 2020), demonstrating negative dynamics in the recent years: from $14 400 in 2017 to $13 400 in 2020 [3].
According to The Global Competitiveness Report 2019, presented by the World Economic Forum, the country is placed 57th, ahead of Peru. In terms of high-tech products export, Colombia is 55th in the world, behind Costa Rica, but ahead of Chile in the region [3]. According to the Index of Economic Freedom, which is based on freedom of business, freedom from government action, property protection, and freedom from corruption, Colombia was 42nd in 2018 out of the 180 countries and 49th in 2021 out of the 178 countries considered, ahead of Mexico. In terms of gold reserves and foreign exchange reserves in 2017 Colombia was 42nd in the world, ahead of Chile, but behind Argentina. According to the indicator for the average GDP growth in percentage over the last 10 years, in 2020 the country was 91st out of 206 countries. In terms of public debt, calculated as a percentage of the country's GDP, Colombia was ranked 102nd out of 210 countries considered in 2017.
Energy Resources
Colombia has significant reserves of mineral resources. In addition to large deposits of coal, oil and natural gas, there are shale gas, shale oil, and extra heavy oil reserves. In terms of tonnes of oil equivalent, proved reserves of coal were 89.9%, of the total fossil fuel resources in 2021, oil resources 7.9%, and gas 2.2%. Colombia has the second largest coal reserves in South America behind Brazil, amounting to 5 trillion short tons in 2020 [6].
According to BP [7], total proved coal reserves in the country in 2020 were estimated at 4554 million tonnes. At the beginning of 2022, according to the U.S. Energy Information Administration Colombia had about 3 Tcf of natural gas [6].
Table 1. Fossil energy resources of Colombia
| Resource /Explanations | Crude oil* | Natural gas* | Coal* | Shale Gas** | Tight Oil** | Coal mine methane | Extra Heavy Oil& Oil Sands |
|---|---|---|---|---|---|---|---|
| Value | 2.04(0.12%) | 3.8(0.05%) | 5 020(0.43%) | 54.7 | 6.8 | 48-122 | 30 |
| Unit | billion barrels | Tcf | million short tons | Tcf | billion barrels | Bcm | billion barrels |
| Year | 2021 | 2020 | 2021 | 2013 | 2013 | 2018 | 2008 |
| Source | [6] | [6] | [6] | [8] | [8] | [7,10] | [9] |
*share of the country’s reserves in world total is provided in brackets
**unproved technically recoverable
According to the U.S. Central Intelligence Agency [3] reserves of natural gas in Colombia in 2021 were estimated at 87,782 Bcm. Colombia has the fifth largest reserves of shale gas in South America with 54,7 Tcf [8]. According to [6], oil reserves in Colombia in 2022 were estimated at 1.8 billion barrels; 2.036 and 2.0 billion barrels in 2021 according to other sources [3,7]. Technically recoverable shale (tight) oil are estimated [8] to be 6.8 billion barrels, which is higher than Brazil's stocks, but much less than neighbouring Argentina. According to the calculations of Advanced Energy Technologies, the potential for coal mine methane utilization, according to a methodology based on methane emissions [10] and coal reserves [7], amounted to about 48-122 billion m3. Colombia also has gas hydrates occurrences on the northern shelf of the country (Fig.5).
In Colombia, there is a certain potential for the development of some types of renewable energy. A selection of basic indicators of this type of resource is presented in Table 2.
The level of solar radiation is low (4.9-5.5 kWh/m2/day) and scattered over most of the country. In the northern region, in the Department of La Guajira and the Department of Santander the figure is slightly higher, reaching 6.0 kWh/m2/day [11].
The allocation of wind resources looks similar: in the central part of the country the average annual wind speed is typically less than 5.0 m/sec. However, along the country’s northern coastline with the Caribbean Sea, the average annual wind speed can reach more than 8 m/s [12].
Colombia has a vast network of rivers that includes mountainous and lowland rivers, the largest of which are the Amazon and the Orinoco. Nevertheless, according to [13] Colombia has a small gross theoretical hydro potential — 1000 GWh/year, second to almost most of the countries in the region, but taking into account population density and size of the country, this resource is substantial.
Table 2. Renewable energy resources of Colombia
| Resource/ Explanations | Solar Potential (GHI)* | Wind Potential (50 м)* | Hydro energy Potential** | Bio Potential (agricultural area) | Bio Potential (forest area) | Municipal Solid Waste |
|---|---|---|---|---|---|---|
| Value | 4.9-5.5 | < 5.0 | 1000 | 43.5 | 53.5 | 0.76 |
| Unit | kWh/m2/day | m/s | GWh/year | % of land area | % of land area | kg/per capita/day |
| Year | 2018 | 2018 | 2009 | 2020 | 2020 | 2016 |
| Source | [11] | [12] | [13] | [15] | [16] | [17] |
*for most of the territory of the country
**gross theoretical hydro power potential
Moreover, in coastal areas, there are conditions for utilising the energy of the ocean and sea waves on the Atlantic (10-15 kw/m per year), and on the Pacific coast (<5 kw/m per year) [14]. More than 53% of Colombia is forested, and this is a significant biological resource for the production of energy [16]. It is also worth mentioning the level of municipal waste produced in the country, which can be used for energy production. The level of solid waste generation in Colombia is high — 0.76 kg per person per day [17].
Energy Balance
Primary energy consumption in 2021 in Colombia was dominated by oil (36.5%), followed by hydroelectric power (29.2%), gas (23.4%), coal (6.8%) and renewables (3.6%) [7].
There has been an increase in oil production between 2007-2013, which can be seen in Figure 2 and was probably connected with the discovery of new deposits outstripping growth in oil prices. In 2021, production of crude oil and petroleum products were around 764 thousand barrels/day, while consumption in 2020 was at the level of 282 thousand barrels/day [18]. According to BP oil production in 2021 was 738 thousand barrels/day, and consumption — 370 thousand barrels/day [7]. This allowed the country to export most of the oil it produced. The main importer of resource is the US, which received about 180 thousand barrels/day in 2021 [6].
Production and domestic consumption of natural gas in Colombia has steadily increased over the last 10 years, and since 2007 the country has been able to export part of the natural gas produced to neighbouring Venezuela [18]. In 2021, production of natural gas in Colombia was estimated at 403 Bcf, and consumption — at 415 Bcf [18,6]. According to BP [7], in 2021 the country produced about 12.6 Bcm and the same amount consumed.
Colombia is the largest coal producer in the region, and about 71% of total coal imports of the U.S. come from Colombia in 2020 [6]. Production and exports of coal have risen steadily over the past 15 years (Figure 2). In 2021, according to [6] Colombia produced about 62 million short tons of coal, while it consumed almost 5 million short tons of coal. In 2019 these numbers were — 92.9 million short tons and 10.2 million short tons respectively. According to [6] around 75 million short tons were exported mainly to Europe, and Latin America in 2020 [6].
Source: U.S. Energy Information Administration (Sep 2023) / https://www.eia.gov
Figure 2. The production and consumption of fossil fuels in Colombia (left —coal, in the center — gas, right — oil)
In the production of electricity, hydropower dominates all the other sources – Fig. 3. In 2020 hydropower has generated more than about 65.7% of electricity, while the share of fossil fuels accounted for 32.9%. In 2020, Colombia produced 69.74 billion KWh of electricity. Over the past 15 years there have been minor changes in the share ratio between fossil and renewable fuels in electricity production.
Sources: U.S. Energy Information Administration (Sep 2023) / www.eia.gov | ||
| Figure 3. Electricity production in Colombia |
The total share of other technologies in the Colombia’s position in the comparative diagram of energy index is shown in Figure 4. The first six indices based on reserves of fossil fuels and export opportunities show Colombia’s distinct advantage over most of the world, especially when it comes to coal. The share of renewable energy in electricity production in Colombia is less than 2%, according to the Central Intelligence Agency, and in 2017 the country was 136th out of 170 countries selected for consideration.
| Sources: 1. Crude oil proved reserves, 2021 / International Energy Statistic/Geography / U.S. Energy Information Administration (Nov 2021)*98 2. Natural gas proved reserves 2021 / International Energy Statistic / Geography / U.S. Energy Information Administration (Nov 2021) *99 3. Total recoverable coal reserves 2019 / International Energy Statistic / Geography / U.S. Energy Information Administration (Nov 2021) *81 4. Combination production-consumption for Crude oil 2018 / International Energy Statistic / Geography / U.S. Energy Information Administration (Nov 2021) *219 5. Combination production-consumption for Natural gas 2019 / International Energy Statistic / Geography / U.S. Energy Information Administration (Nov 2021) *123 6. Combination production-consumption for Coal 2019 / International Energy Statistic / Geography / U.S. Energy Information Administration (Nov 2021) *128 7. Electricity – from other renewable sources (% of total installed capacity), 2017 est. / The World Factbook / Library / Central Intelligence Agency *170 8. GDP per unit of energy use (PPP per unit of oil equivalent), 2020 *66 Primary energy consumption - BP Statistical Review of World Energy 2021/BP;GDP (purchasing power parity) - The World Factbook/Library/Central Intelligence Agency 9. Energy use (primary energy use of oil equivalent per capita) 2020 *127 Primary energy consumption – BP Statistical Review of World Energy 2021; Population - United Nations, Department of Economic and Social Affairs, Population Division (2019). World Population Prospects 2019, custom data acquired via website. Retrieved 15 November 2021*66 10. The Global Energy Architecture Performance Index Report (EAPI) 2017 / Rankings / Reports / World Economic Forum 11. Electric power consumption (kWh per capita), 2016 *217 Electricity Consumption - The World Factbook / Library / Central Intelligence Agency; Population - United Nations, Department of Economic and Social Affairs, Population Division (2019). World Population Prospects 2019, custom data acquired via website. Retrieved 15 November 2021 12. Combination of electricity production-consumption (kWh)/The World Factbook/Library/Central Intelligence Agency *216 * Total number of countries participating in ranking Figure 4. Energy indices of Colombia |
In the Energy Architecture Performance Index 2017, which is based first on the level economic growth, environmental safety, and energy independence of the country, including access to energy, Colombia is 8th in the world, ahead of Mexico and Chile.
Colombia is in the top ten of the ranked list of countries for such indicators as GDP per unit of energy use in 2020 — 10th out of 66 countries considered, while energy consumption per capita is much lower — 58th out of 66 countries. In terms of electricity consumption per capita, the country is 130th in the world, however, for the indicator of combination of electricity production-consumption, Colombia is 47th in the ranked list of 216 countries.
Energy Infrastructure
Map of territorial distribution of the largest infrastructure projects of the fossil fuel sector in Colombia is shown in Figure 5.
As previously mentioned, coal is the main fossil fuel resource of Colombia. Major coal deposits are in the north of the country. The largest of those is the Cerrejon mine (37.7 million short tons) (Figure 5). The main gas fields of the country are located in offshore areas and on the mainland, and are located mainly in the north and in the central part of the country. The largest are in the Cusiana and Cupiaga Llanos basins, which are owned by Ecopetrol and Talisman Energy [19].
Similar to the gas industry, oil fields are concentrated in the centre and the north of the country, the largest being the Rubiales Oil Field, located in the department of Meta. According to the Government of Colombia, the reserves of this field are estimated to be 500 million barrels [20]. The oil extracted from this deposit is heavy.
The main brands are Cano Limon Crude (API 29º) and Vasconia Crude Oil (API 24.3º) [21,22]. Around 415 000 barrels of oil are processed every day in Colombia [23]. The major refineries are located in the north of the country. Barrancabermeja Oil Refinery owned by Ecopetrol has an installed capacity of 250 000 barrels / day [24].
Figure 5. Basic infrastructural facilities of Colombia: fossil fuels
The government plans to upgrade the plant and increase its capacity to 300 000 barrels/day, however, according to the company officials, the drop in global oil prices is preventing the implementation of this project [25]. The main oil producer in Colombia is a national company Ecopetrol, and about 70 international companies are present in the Colombian oil market. The largest gas producer is Chevron [20].
It is also worth noting that the first Colombian LNG terminal at Cartagena, with an installed capacity of 500 000 tons/year, started working in 2016 [26]. A floating storage and regasification unit (FSRU) «Höegh Grace», owned by the Norwegian company, Höegh LNG, supports the work of the terminal [27].
Figure 6 shows the major sites in Colombia producing electrical energy.
The share of fossil fuels in electricity production in Colombia does not exceed 32.9%. At the same time about 65.7% comes from hydroelectricity and 1.4% of energy from renewable sources (Figure 6).
Figure 6. Electricity production in Colombia
11 hydropower plants have a capacity of over 330 MW, with two hydroelectric plants, San Carlos I and II and Guavio, both with over 1 GW [28].
Gas power plants and combined cycle power plants are also widespread throughout the country. The largest of these is Termobarranquila, with a capacity of 750 MW[29]. There are also 5 coal plants with a capacity of over 100 MW, and the largest of these is Termoguajira station with two blocks of 162 MW each and 168 MW [30].
Figure 7 shows the main objects of Colombian infrastructure for energy production from renewable sources.
Figure 7. Basic infrastructural facilities of Colombia: renewable energy
As noted above, apart from hydro power renewable energy in Colombia has no strong influence on the production of the main types of energy. This is clearly due to the presence of rich deposits of fossil fuels, and partly with resource allocation features of renewable energy across the country.
Thus, the level of solar radiation in the most densely populated areas of Colombia is an average of 4.9-5.5 kWh/m2/day [10]. Wind energy is in similar situation; the average wind speed does not exceed 4.9 m/sec [11]. Nevertheless, Colombia has one wind farm, Jepirachi, with an installed capacity of 19.5 MW in the north, where the wind speed reaches its peak [31]. Installed capacity of bioenergy constitute 0.37 GWe [32]. Biodiesel and bioethanol production are widespread in Colombia. The company Ingenio Providencia has been successfully advancing technology for bioethanol production (Figure 7). Two companies for LFG (landfill gas) processing, owned by EVM are also operating in the country. There are a few relatively large companies, using biomass for energy production. In 2020, bio-energy produced about 1.71 TWh of electricity (Figure 7). However, it should be noted that there has not been significant growth in installed capacity of renewable energy sector in the last 5 years.
Education and Innovation
The set of indices reflecting the position of Colombia among other countries in the field of education and innovation can be seen in Figure 8.
In the country ranking in accordance with The Global Innovation Index in 2021, Colombia was 67th, behind Mexico and Uruguay.
According to the number of patents granted to Colombian residents, both inside the country and abroad, the country ranks 54th in the world. Similarly, by the number of patents in force, the country 55th in the world, which largely characterizes the country's patent attractiveness.
| Sources: 1. The Global Innovation Index 2021, Rankings / Knowledge / World Intellectual Property Organization / Cornell University, INSEAD, and WIPO (2021): Energizing the World with Innovation. Ithaca, Fontainebleau, and Geneva *132 2. Patent Grants 2011-2020, resident & abroad / Statistical country profiles / World Intellectual Property Organization *185 3.Patents in Force 2020 / Statistical country profiles / World Intellectual Property Organization *109 4. QS World University Rankings 2022 *97 5. SCImago Country Rankings (1996-2020) / Country rankings / SCImago, (n.d.). SIR-SCImago Journal & Country Rank [Portal]. Retrieved 17 Nov 2021 *240 6. Internet users in 2018 / The World Factbook / Central Intelligence Agency *229 7. Internet users in 2018 (% Population) / The World Factbook / Central Intelligence Agency *229 8. Government expenditure on education, total (% of GDP), 2019 / United Nations Educational, Scientific, and Cultural Organization (UNESCO) Institute for Statistics. License: CCBY-4.0 / Data as of September 2021*177 9. Research and development expenditure (% of GDP), 2018 / UNESCO Institute for Statistics. License: CCBY-4.0 / Data *119 10. Scientific and technical journal articles, 2018 / National Science Foundation, Science and Engineering Indicators. License: CCBY-4.0 / Data *197 * Total number of countries participating in ranking Figure 8. The indices of education and innovation in Colombia |
Colombia is well positioned when considering the number of publications of specialists in scientific and technological journals — 43rd place out of 197 countries considered. It is also regarded highly by the Scimago Journal and Country Rank (48th place).
In terms of government expenditure on education as a percentage of the country's GDP, the country demonstrates a result close to the world average – 76th out of 177 countries selected for consideration. Nevertheless, 19 Colombian universities are included in the QS University Rating.
In terms of the amount of government expenditure on research and development as a percentage of GDP, the country is 83rd in the world, behind Cuba and Argentina.
Universidad de Antioquia, Universidad de los Andes, Universidad del Norte, and Universidad Nacional de Colombia train specialists in the field of energy. These universities offer programmes in various engineering specialties, including Electrical and Electronical Engineering, Civil Engineering, Mechanical Engineering, Environmental studies, etc.
Universidad Nacional de Colombia and Funcacion Universidad de America are actively involved in the research in the field if associated petroleum gas. Petroraza SAS is among the leaders of patenting among Colombian companies in the field of extraction and processing of unconventional oil. Studies in this field have been conducted by Universidad Nacional de Colombia, Ecopetrol, Pacific Rubiales Energy S.A.
Research on coal seam methane is carried out by Ecopetrol.
Petroraza SAS has the largest number of patents, in the field of non-traditional oil production, including directional drilling and hydro-cracking. Ecopetrol and ICP Ecoperol are conducting researching in this field.
In the field of synthetic fuel development the biggest patent-holders as well as leaders in the number of publications in the field are Universidad Nacional de Colombia and Universidad de Antioquia.
The leading patent holder in the field of bioenergy is Universidad Del Valle. Research and development in this field is also being carried out by Universidad Nacional de Colombia, Universidad de los Andes and Universidad del Norte.
A large number of Colombian universities conduct research in the field of energy production from renewable sources. In the field of wind energy — Universidad Nacional de Colombia, Universidad Pontifica Bolivariana, Universidad de San Buenaventura Cartagena, Universidad de los Andes.
The main research institutes in the field of solar energy are Universidad del Norte, Universidad EAFIT.
Ecology and Environment Protection
A diagram of environmental indices is shown in Figure 9. This diagram is dramatically different from the previous graphs as three of the eight selected indices are situated in the red part of the graph. Colombia is among the "leaders" in the amount of carbon dioxide emission, methane emission and deforestation. In terms of methane emissions Colombia has one of the worst indicators.
However, there are positive trends, they are expressed first of all in the changes in forest area.
| Sources: 1. CO2 total emission by countries 2020 / European Commission / Joint Research Centre (JRC) / Emission Database for Global Atmospheric Research (EDGAR)*208 2. CO2 per capita emission 2020/European Commission/Joint Research Centre (JRC) / Emission Database for Global Atmospheric Research (EDGAR) *208 3. Forest area 2020 (% of land area) / The Global Forest Resources Assessment 2020 / Food and Agriculture Organization of the United Nations *234 4. Forest area change 2010-2020 (1000 ha/year) / The Global Forest Resources Assessment 2020 / Food and Agriculture Organization of the United Nations *234 5. The Environmental Performance Index (EPI) 2020 / Rankings / Yale Center for Environmental Law & Policy / Yale University *180 6. Annual freshwater withdrawals (m3 per capita), 2017 *179 Annual freshwater withdrawals, total (billion m3), 2017 – Food and Agriculture Organization, AQUASTAT data. /License: CC BY-4.0; Population – United Nations, Department of Economic and Social Affairs, Population Division (2019). World Population Prospects 2019, custom data acquired via website. Retrieved 15 November 2021 7. The National Footprint Accounts 2017 (Biocapacity Credit / Deficit) / Global Footprint Network *188 8. Methane emissions (kt of CO2 equivalent), 2018 / Data for up to 1990 are sourced from Carbon Dioxide Information Analysis Center, Environmental Sciences Division, Oak Ridge National Laboratory, Tennessee, United States. Data from 1990 are CAIT data: Climate Watch. 2020. GHG Emissions. Washington, DC: World Resources Institute. Available at: License : Attribution-NonCommercial 4.0 International (CC BY-NC 4.0) *191 9. The Climate Change Performance Index (CCPI) 2022 / Overall Results / Jan Burck, Thea Uhlich, Christoph Bals, Niklas Höhne, Leonardo Nascimento / Germanwatch, NewClimate Institute & Climate Action Network *60 * Total number of countries participating in ranking Figure 9. Environmental Indices of Colombia |
It is obvious that this issue is one of the main ecological priorities for the Government. This is also reflected in the Environmental Performance Index 2020, which focuses primarily on assessing the environmental performance of national governments. Here Colombia is ranked 50nd place, ahead of Venezuela, showing the highest rates of wastewater treatment plants. According to the Environmental Vulnerability Index, Colombia is one of the "vulnerable" countries. In conclusion, it should be added that historically Colombia is an ecological creditor according to the Ecological Footprint Atlas.
References
[1] List of sovereign states and dependencies by area / Wikipedia / https://en.wikipedia.org/wiki/List_of_sovereign_states_and_dependencies_by_area
[2] List of countries and dependencies by population density / Wikipedia / https://en.wikipedia.org/wiki/List_of_countries_and_dependencies_by_population_density
[3] Colombia / The world factbook / Library / Central Intelligence Agency / https://www.cia.gov/
[4] GDP, PPP (constant 2011 international $) / World Bank, International Comparison Program database. License: CC BY-4.0 / Data / The World Bank / http://www.worldbank.org/
[5] GDP per capita, PPP (current international $)/ World Bank, International Comparison Program database. License: CC BY-4.0 / Data / The World Bank / http://www.worldbank.org/
[6] International Energy Statistic / Geography / U.S. Energy Information Administration / www.eia.gov/beta/international/
[7] BP Statistical Review of World Energy 2022 (PDF) / BP / https://www.bp.com/
[8] World Shale Resource Assessments (PDF)/ U.S. Energy Information Administration (11/28/2018 )/ https://www.eia.gov/
[9] 2010 Survey of Energy Resources (PDF) / World Energy Council / www.worldenergy.org/
[10] 2006 IPCC Guidelines for National Greenhouse Gas Inventories, Volume 2, Energy, Fugitive Emissions (PDF) / The Intergovernmental Panel on Climate Change (IPCC) / https://www.ipcc-nggip.iges.or.jp/
[11] Solar resource data obtained from the Global Solar Atlas, owned by the World Bank Group and provided by Solargis / Global Solar Athlas / http://globalsolaratlas.info/
[12] Wind Map / Global Wind Atlas 2.0, a free, web-based application developed, owned and operated by the Technical University of Denmark (DTU) in partnership with the World Bank Group, utilizing data provided by Vortex, with funding provided by the Energy Sector Management Assistance Program (ESMAP). For additional information: https://globalwindatlas.info
[13] 2013 Survey of Energy Resources (PDF) / World Energy Council / www.worldenergy.org/
[14] Wave power/ Wikipedia / https://en.wikipedia.org/wiki/Wave_power
[15] Agricultural land (% of land area) / Food and Agriculture Organization, electronic files and web site. License: CC BY-4.0 / Data / The World Bank / http://www.worldbank.org
[16] Forest area (% of land area) /Food and Agriculture Organization, electronic files and web site. License: CC BY-4.0 / Data / The World Bank / http://www.worldbank.org/
[17] What a Waste (PDF) / Data / The World Bank / http://www.worldbank.org
[18] International Energy Statistic / Geography / U.S. Energy Information Administration (Jan 2019) /http://www.eia.gov/beta/international/
[19] Columbia / Data / World Energy Council / www.worldenergy.org/
[20] Colombia Oil and Gas Profile / A Barrel Full / http://abarrelfull.wikidot.com/
[21] Cano Limon Crude / A Barrel Full / http://abarrelfull.wikidot.com/
[22] Vasconia Crude Oil / A Barrel Full / http://abarrelfull.wikidot.com/
[23] 2019 Annual Statistical Bulletin / OPEC / https://www.opec.org/
[24] Ecopetrol—Barrancabermeja Oil Refinery / Industry About / http://www.industryabout.com/
[25] Ecopetrol defers Barrancabermeja refinery revamp / Robert Brelsford / Mar 11th, 2016 / Oil and Gas Journal / http://www.ogj.com/
[26] Colombia LNG Terminal Project / A Barrel Full / http://abarrelfull.wikidot.com/
[27] Höegh LNG - FSRU Höegh Grace Arrived in Cartagena, Colombia (Video) / Milton Stuards, Nov 2, 2016 / Vessel Finder / https://www.vesselfinder.com/
[28] Current List of Hydro PowerPlants / Global Energy Observatory / http://globalenergyobservatory.org/
[29] Current List of Gas PowerPlants / Global Energy Observatory / http://globalenergyobservatory.org/
[30] Termoguajira Coal Power Plant / Industry About / http://www.industryabout.com/
[21] Project Profile : Jepirachi, Colombia / Nordex Online / http://www.nordex-online.com/
[32] Colombia / Country / IRENA REsources / http://resourceirena.irena.org/
The sources of charts and curves are specified under the images.
For more information about the energy industry in Colombia see here