Major Renewable Energy Infrastructure Projects. European Economic Area (EEA) + the United Kingdom and Switzerland. (2020 Edition), Wall map
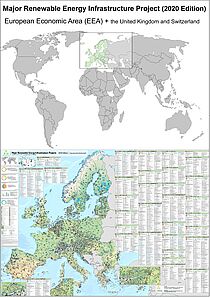
Major Renewable Energy Infrastructure Projects.
European Economic Area (EEA) + the United Kingdom and Switzerland.
(2020 Edition)
Wall map, Scale 1:4 700 000
Size: 1 265 mm x 895 mm
Format: Rolled
Mapping contents
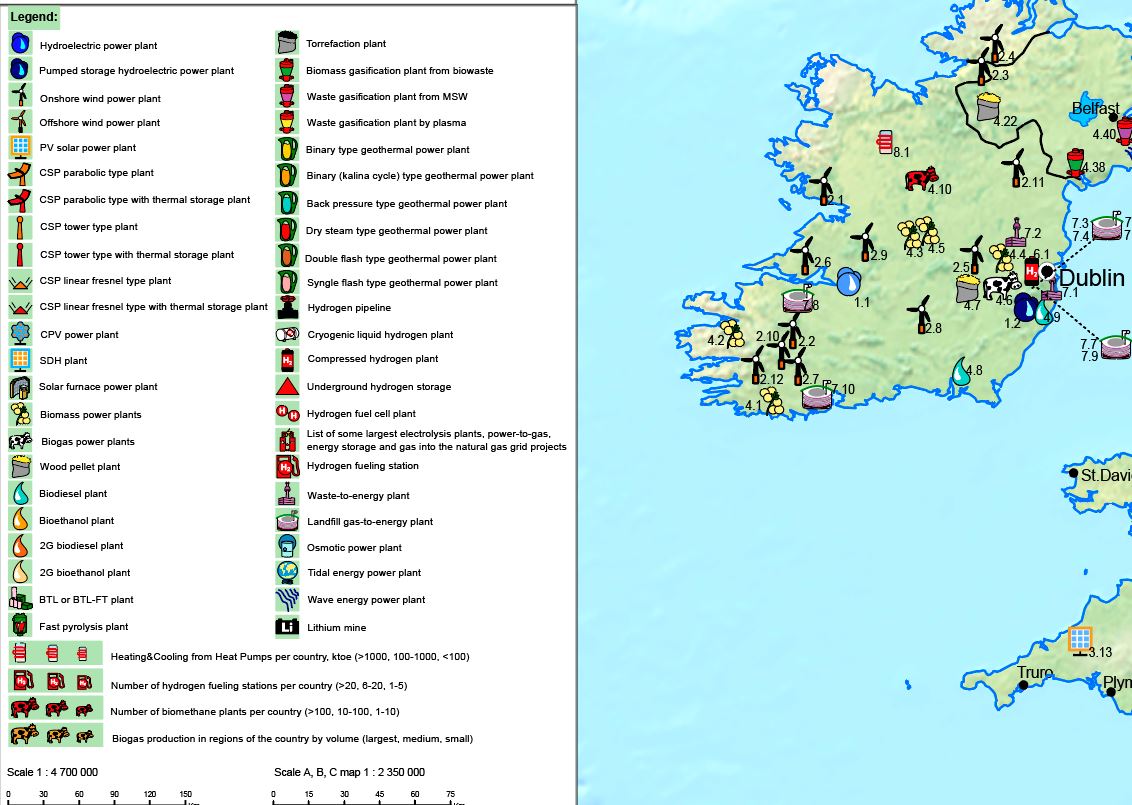
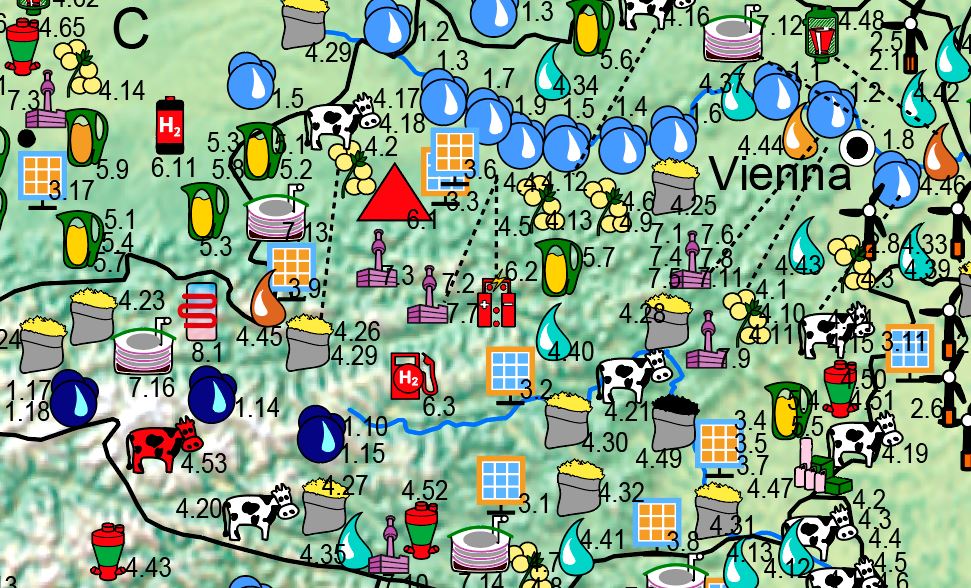
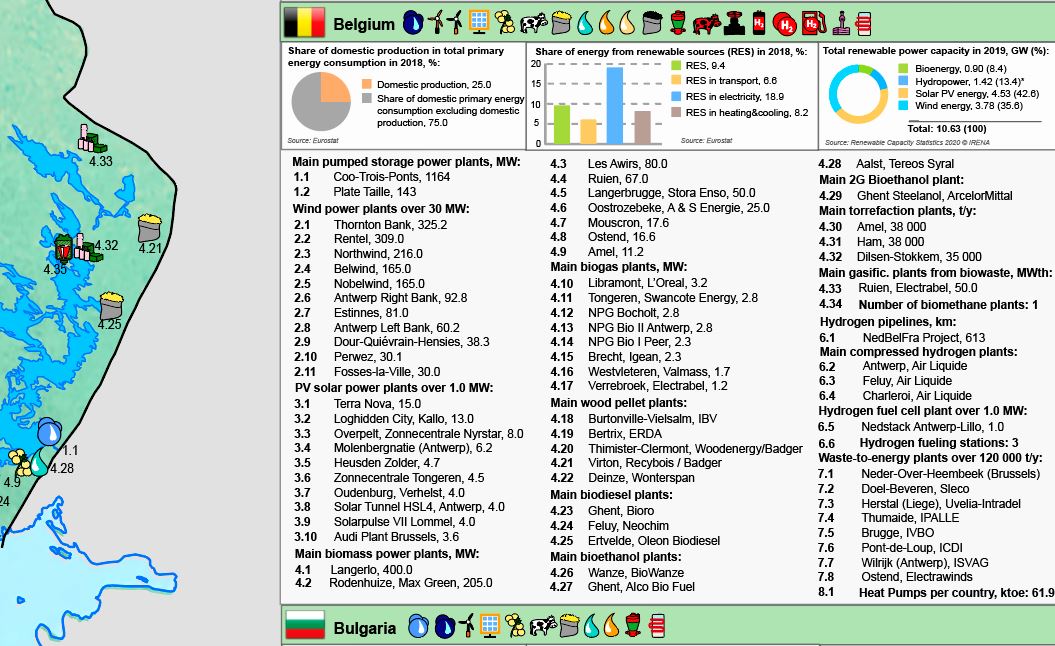
This map shows more than 2000 of the largest and most notable renewable energy facilities located in the European Economic Area (EEA), the United Kingdom, and Switzerland. Each facility is depicted by a distinct icon corresponding to a specific type of renewable energy. For all facilities names and other relevant data are given, allowing for easy identification. Where relevant production capacity or volume of products is also indicated.
Each of the countries on the map is provided with accompanying graphical information for 2018-2019, illustrating the share of domestic production in relation to total primary energy consumption (or share of domestic consumption in total production), as well as the share of energy production from various types of renewable sources and total renewable power capacity. Similar data is presented separately for the European Union as a whole. Comparative statistics of world GNI per capita in 2018, PPP (current international $) and CO2 total emissions (%) are provided for geographical regions or subregions.
In addition, for a number of countries generalized indicators are provided, which correspond to one of three quantitative ranges that illustrate the level of development of specific renewable energy technologies: heating & cooling from heat pumps; number of hydrogen fuelling stations; number of biomethane plants; domestic biogas production by region; and small hydropower plant installed capacity.
Countries with a high concentration of facilities are presented in zoomed-in sidebars, including Austria and Southern Germany, Switzerland, Belgium, and the Netherlands.
The geographic placement of infrastructural facilities on the map has been made using actual coordinates, though where facilities were too closely located to each other they were deliberately separated to avoid overlapping.
The map is printed on paper, has a matt laminate finish and is supplied rolled.
Limitation of liability
The data presented on the map is intended for information purposes only. It is not for any professional use, nor is it a guide to action. EnerTechUp has prepared this material with due diligence, discretion and professionalism, without, however, claiming that the information presented on the map is complete, accurate and up-to-date. EnerTechUp presents this material “as is” and, by following the sources of information used on this map, declares a limitation of liability, assumes no liability and disclaims any claims related to the use of this map. Please report any errors, misunderstandings or inaccuracies you find to [email protected]