The world's leading patent offices (WIPO, IP5) released key statistics for 2020 at the end of last year. Additional interest in these materials is undoubtedly due to the fact that 2020 was influenced by the coronavirus pandemic and 2019 saw a significant drop in patent activity in China, the most productive country in the world in terms of invention. However, the data presented proved the expected pessimistic predictions wrong.
First of all, it should be noted that the number of active patents continues to grow. In 2020, their number increased by almost 6% to 15.9 million, and over the past decade the growth was more than 70%. The largest number of patents remaining in force is concentrated in the European Patent Office EPO – more than 30%. It is followed by the USPTO and CNIPA by a notable margin.
Patents in Force end 2019
Source: five IP offices
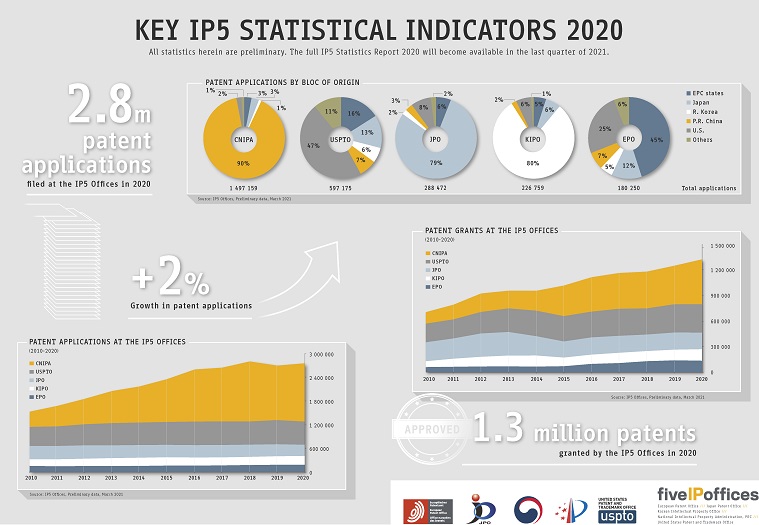
In 2020, a total of 3,276,700 patent applications were registered and 1,592,000 patents were granted worldwide. This is about 50,000 more applications and nearly a 100,000 more patents than in 2019. Although the peak of more than 3.25 million patent applications registered in 2018 was not reached, the year 2020 was the most productive year for the number of patents granted.
The most impressive growth in 2020 out of the top five patent offices was shown by the offices of China and the Republic of Korea. The number of granted patents in CNIPA increased by 17.1%, and patent applications by 6.9%, and in the Republic of Korea, by 7.2% and 3.6%, respectively. JPO, EPO and USPTO, on the contrary, saw a reduction in patent activity as compared with the previous year, both in the number of granted patents and in the number of registered patent applications.
Despite the positive data cited above, one cannot ignore the noticeable negative trends. While the decline witnessed at the Chinese patent office in 2019 has been replaced by a significant increase, the annual decline in patent activity in Japan looks like a well-established long-term trend. The USPTO may have passed its peak of annual patent application registrations as well. The state of patent activity is illustrated more clearly by the relationship of the number of applications to the number of documents by year.
Relationship of number of applications to number of documents by year A/S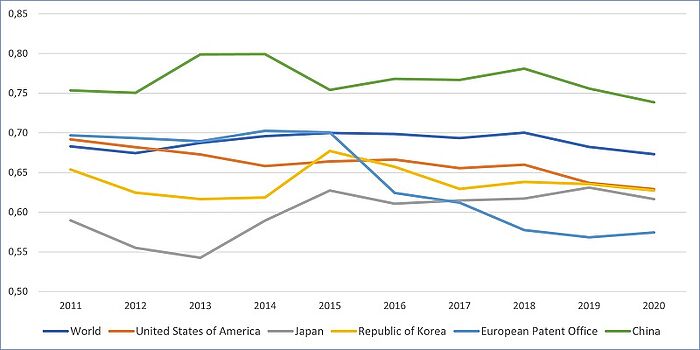
Source: based on WIPO IP Statistics Data Center
Since the patenting process lasts several tens of months, the number of patents granted each year is the result of inventions of previous periods. On the other hand, patent applications are the product of ongoing inventive activity. Taking this into account, the decrease or increase in the ratio of patent applications to the total number of patent documents can be an indicator of the patent activity of the nearest future periods. As follows from the graph above, there are no upward trends in the A/S ratio, but its decrease in recent years can be guessed for most participants.
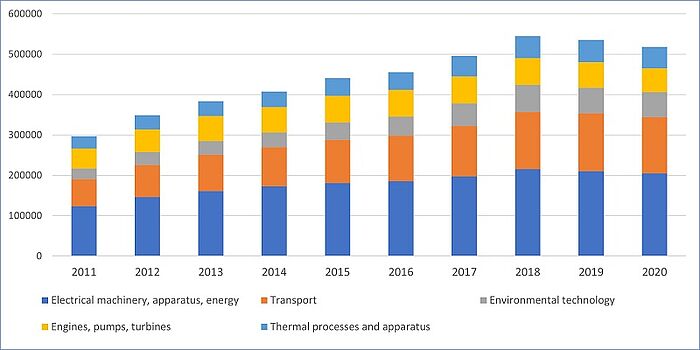
Unfortunately, WIPO and IP5 do not have detailed statistics for the main energy sectors, such as renewable energy or fossil fuels. Nevertheless, here is a graph of the evolution of the number of patents granted for fields of technology directly or indirectly related to energy, as well as to environmental technologies. Over the past decade, the most significant growth in patenting has been found for such fields as Transport, Thermal processes and apparatus, as well as Environmental technology. A more restrained growth is characteristic of Electrical machinery, apparatus, and energy. The patenting for Engines, pumps, turbines was characterized by maximum stability.
The number of patents granted in the last decade for the energy-related fields of technology
Source: based on WIPO IP Statistics Data Center
The largest number of patents in the field of wind energy for the period from 2010 to 2019 were granted to: Vestas Wind System AS Denmark, General Electric U.S., Wobben Properties GMBH Germany, Siemens AG Germany, Mitsubishi Heavy Ind Ltd Japan. For solar energy, the list of the most active applicants is as follows: Sharp KK Japan, LG Electronics Inc Republic of Korea, LG Innotek Co Ltd Republic of Korea, Mitsubishi Electric Corp Japan, Sunpower Corp U.S.
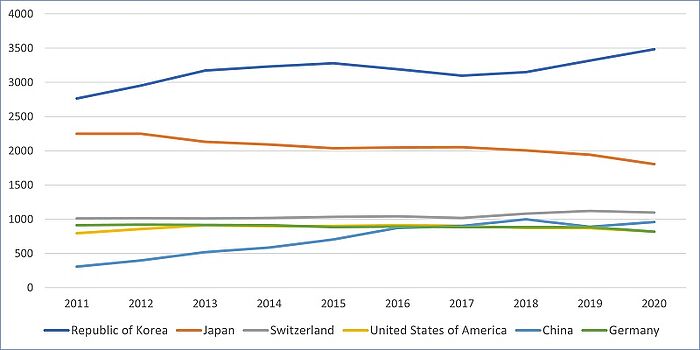
The WIPO IP Statistics Data Center also lists the top countries in terms of inventive activity. Below are the top six countries in terms of the number of patent applications per million inhabitants.
Resident applications per million population
Source: based on WIPO IP Statistics Data Center
The undisputed leader in this indicator is the Republic of Korea, which in recent years has far outpaced the other participants. Japan's share has dropped significantly, but it is still significantly higher than Switzerland, China, the United States, and Germany.
Energy News Monitoring
Patent activity worldwide in 2020