The current review includes key statistical indicators that were identified as a result of the analysis of patent applications filed in the patent offices around the world in 2018 on topics related to the conversion of solar energy using various types of concentrators. In total, during the patent search, as of the date of this review, 1,442 patent applications were identified, which were filed by 741 applicants from 43 countries and registered in 31 world patent offices. Patent document retrieval and processing procedures are available on the Advanced Energy Technologies website. The list of technological areas as well as the distribution of identified patent documents among them is presented in the figure below.
According to the findings, the inventors were most interested in Concentrator photovoltaic technologies, which were mentioned in more than a quarter of patent documents. Perhaps due to the increased interest of inventors in the coming years, this technology will receive a more dynamic development, given that there is experience in implementing large projects (Touwsrivier CPV Solar Project in South Africa and Golmud CPV Solar Park in China). The more developed industrial and commercially proven technologies of Parabolic trough and Solar tower were also seriously enriched by new technical solutions of the inventors, and their total representation exceeded one third of the total number of patent documents.
The distribution of patent documents by technology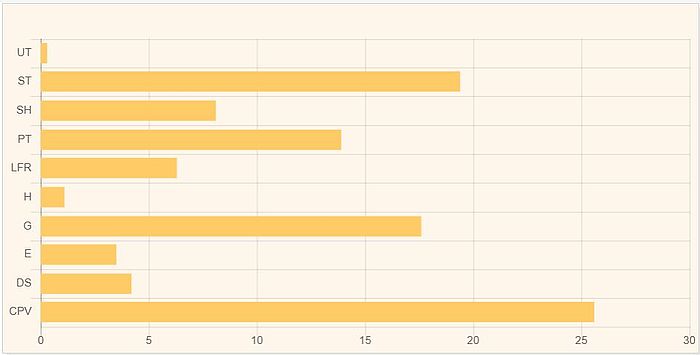
Source: Advanced Energy Technologies
CPV - Concentrator photovoltaics; DS - Dish / Stirling; E - Experimental CSP; G - CSP in general; H - Solar heating; LFR - Linear Fresnel reflector; PT - Parabolic trough; SH - Storage CSP or Hybrid CSP; ST - Solar tower; UT - Solar updraft tower
The largest number of patent applications on this subject in 2018 was registered in the Chinese Patent Office (36%), and with a considerable margin. Over 250 patent applications have been filed at the US Patent Office, about 200 at WIPO and about 120 at EPO. In total, the top 10 offices included about 90% of patent applications of the total.
Distribution of patent applications, published by the top 10 patent offices
| Offise | 2018 | Share of total, % |
|---|---|---|
| State Intellectual Property Office, China | 520 | 40.5 |
| European Patent Office | 118 | 9.2 |
| National Institute of Industrial Property, Chile | 22 | 1.7 |
| National Institute of Industrial Property, Brazil | 22 | 1.7 |
| IP Australia | 34 | 2.5 |
| Japan Patent Office | 50 | 3.9 |
| Korean Intellectual Property Office, South Korea | 33 | 2.6 |
| Moroccan Office of Industrial and Commercial Property | 23 | 1.8 |
| United States Patent and Trademark Office | 266 | 20.7 |
| World Intellectual Property Organization | 197 | 15.4 |
Source: Advanced Energy Technologies
Also among the top 10 most popular patent offices were the Korean Intellectual Property Office, Industrial Property Office (Japan), IP Australia, National Institute of Industrial Property (Chile), National Institute of Industrial Property (Brazil) and the Moroccan Industrial and Commercial Property Office. It should be noted that in the last three offices patent applications were filed only by non-residents. Non-residents filed approximately the same number of patent documents in the Chinese CNIPA (98 applications) and the American USPTO (104 applications). In all of the top 10 patent offices an extremely wide range of non-residents was observed. For example, representatives from eight countries registered their applications with the Moroccan Industrial and Commercial Property Office, 19 countries with CNIPA, and 22 countries with USPTO.
Chinese and American inventors, as has been the case in recent years, were the most productive - 33% and 25% of patent applications, respectively. From 3 to 6% of applications from the total number were filed by representatives of Germany, Japan, France and Spain.
Distribution of countries of the world by the number of resident applicants in patent applications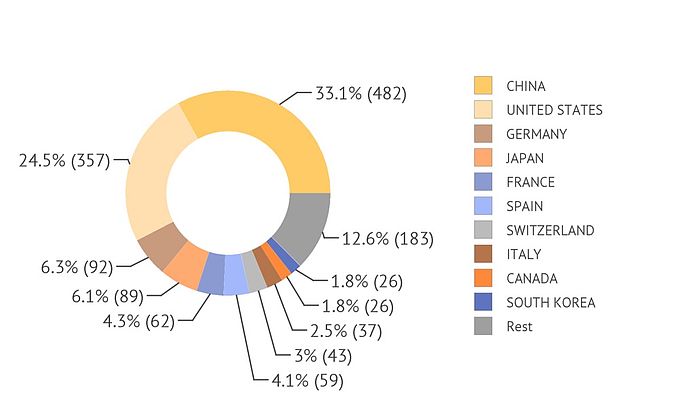
Source: Advanced Energy Technologies
Almost 13% of patent applications were submitted by applicants who were not among the top ten most active countries. In over 1300 patent documents, inventors chose devices as the type of technical solution. Various compositions were mentioned rarely, in only 105 documents.
In general, all patent documents were assigned to 1,081 individual IPC subgroups WIPO, with the subgroup H02S 20/32 being the most popular - about 5% of the total share.
Among the IPC WIPO groups, the following were the most prominent:
- H01L 31/00 –Semiconductor devices sensitive to infra-red radiation, light, electromagnetic radiation of shorter wavelength, or corpuscular radiation and specially adapted either for the conversion of the energy of such radiation into electrical energy or for the control of electrical energy by such radiation; Processes or apparatus specially adapted for the manufacture or treatment thereof or of parts thereof; Details thereof
- F24S 23/00 – Arrangements for concentrating solar rays for solar heat collectors
- H02S 20/00 – Supporting structures for PV modules
- H02S 40/00 – Components or accessories in combination with PV modules, not provided for in groups.
System as a whole, Receivers, Trackers and Energy storage prevailed in the list of technological elements for converting solar energy to the final product in the form of thermal or electric energy.
The table below contains a list of technical, environmental or organizational problems that have been addressed by technical solutions of inventions.
Distribution of technical problems in the patent applications found
| Problem | Average rating | Share, % | Total 2018 |
|---|---|---|---|
| Administrative and organisational problems | 9.14 | 1.2 | 36 |
| Environmental and social impact | 8.8 | 3 | 87 |
| High costs of equipment production | 8.16 | 23.1 | 674 |
| High costs in general | 9.54 | 0.4 | 13 |
| High costs of maintenance | 7.82 | 8.5 | 247 |
| High costs of plant construction | 8.01 | 4.7 | 137 |
| High costs of repair and replacement | 8.12 | 18.2 | 531 |
| Low efficiency due to environmental factors | 7.32 | 2.8 | 82 |
| Low efficiency in general | 9.32 | 0.7 | 19 |
| Low efficiency of optics or absorber | 8.34 | 19.2 | 560 |
| Low efficiency of secondary equipment | 8.32 | 6.3 | 183 |
| Low efficiency due to solar movement | 7.5 | 9.5 | 278 |
| Unclear problem | 7.54 | 2.4 | 69 |
Source: Advanced Energy Technologies
High costs of equipment production, High costs of repair and replacement and Low efficiency of optics or absorber dominated the list of technical problems. Each of these problems has been mentioned in patent documents more than 500 times. In 69 applications, the problems could not be clearly identified.
More detailed information on the methodology as well as on the results of patent researches in the most important fields of contemporary energy industry can be found at Advanced Energy Technologies.