Table of contents
Basic definitions
According [1], to unconventional gas refers to gas in dense rocks, usually sandstone (tight gas), shale gas, mine gas or coal-bed methane, methane hydrates, as well as “Lean gas” and “sour gas”, characterized by a high content of impurities. As already noted in the introduction to this section, in the references below associated petroleum gas is also referred to unconventional gas, i.e. natural gas produced in association with crude oil as defined in [2]. The general scheme of unconventional types of gas and their potential reserves are shown in Fig. 1.
Fig. 1. Methane in various industrial types of gas

Sources: Advanced Energy Technologies based on [3-7]
Interest in unconventional gas has become comprehensive since shale gas production as a variety of unconventional gas has increased sharply in the United States at the beginning of this century. The consequences of this engineering breakthrough are so impressive that they now refer to it as the “shale revolution”. However, according to the figurative remark of Daniel Yergin and Robert Ineson [8] it is rather a “shale gale”, which provided unprecedented growth without the usually indicative laying of the foundation of the event and its subsequent grand opening, but only due to the long-term accumulation of a huge number of what were initially hardly noticeable technical solutions and combining them together in new revolutionary technologies. This breakthrough was so unexpected for many that the concept of “shale revolution” arose. Nevertheless, nothing is born out of the blue and if you look, for example, in patent statistics for the first 10 years of the beginning of this century, on topics related to Hydrocarbon production from low permeability reservoirs and in particular with Directional Drilling and Hydraulic fracturing, you can find several thousand patents and patent applications, which of course, sooner or later, had to be brought to real implementation, which actually happened.
The significance of this event is demonstrated by several diagrams (Fig. 2-3):
Fig. 2-3. Left - natural gas production by the largest producing countries in 2009-2018; Right - the share of shale gas in the total natural gas production in the USA in 2009-2018
Sources: Fig. 2 – Based on BP Statistical Review of World Energy 2019[3]; Fig. 3 – Based on Natural Gas Summary/ U.S. Energy Information Administration (EIA, 2019) [9]; Annual Energy Outlook 2019/ U.S. Energy Information Administration (EIA)
Between 2009 and 2018, natural gas production in the United States increased by approximately 275 billion cubic meters, or by almost 50% [3]. Moreover, if in 2009 the ratio of tight gas + shale gas to traditional gas was 9.8 / 10.8, then in 2018 it amounted to 22.9 / 6.5, i.e. all growth was provided exclusively by the extraction of unconventional gas [9]. Over the same time, growth in natural gas production among other gas producing countries amounted to: 134 billion cubic meters in Russia, 104 billion m3 for Iran, 84 billion m3 for Qatar, 76 billion m3 for China and 83 billion m3 for Australia [3]. If we take into account that in Australia this growth was achieved mainly due to the production of coal-bed methane, and in China, not least because of shale and mine gas, then the scale of the changes becomes clear, when almost half of the world increase in gas production by the largest producers for the last decade was the result of the extraction of its unconventional types.
To a certain extent this also applies to changes in natural gas reserves, although not so significant (Fig. 4). So, if between 1998 and 2008, the increase in proved reserves was almost completely ensured by traditional gas, primarily in Qatar, Iran and Turkmenistan, between 2008 and 2018, the United States ranked among the leaders in increasing reserves [3], and mainly due to shale gas. As follows from the data in Fig. 5, between 2008 and 2017, traditional gas reserves in the United States increased by 193 Tcf (79%), and shale gas by 274 Tcf or more than 11 times. In addition, associated petroleum gas reserves more than tripled, although with a noticeable, almost two-fold, decrease in explored reserves of coalbed methane, the proportion of which, however, is relatively small - less than 1.5% of the total volume of natural gas.
Fig. 4-5 On the left is the increase in natural gas reserves in the world over the past 20 years. On the right is the change in natural gas reserves in the USA between 2008-2017.
Sources: Fig. 4. – Based on BP Statistical Review of World Energy 2019[3]; Fig. 5. – Based on Natural Gas Summary/U.S. Energy Information Administration (EIA) [9]
Thus, unconventional types of gas began to play not just a noticeable, but rather a decisive role in the global gas industry. However, the “shale revolution” taught us another very important lesson - today the forecasted level of hydrocarbon production is determined primarily not by the volume of resources already explored, but by the level of development of hydrocarbon extraction technologies. Not only the volume of production depends on these technologies, but also the volume of resources newly involved in production as they are extracted.
Achieving the profitability of such a gigantic and rapid recovery of new types of hydrocarbons from the bowels of the earth, which were not previously considered economically viable and even technically feasible, fundamentally changes the prevailing ideas about the hydrocarbon resource base as a uniformly growing lazy organism in the conditions of established academic traditions, but really resembles a “shale gale” that really demonstrated how technology can make this organism instantly wake up and transform.
No less impressive may be the involvement of another type of unconventional gas in the production cycle - gas hydrates, since their occurrences are found in different parts of the world, and potential reserves are many times higher than all existing types of gas. Here, everything also depends on the development of technologies based on creative engineering solutions to numerous technical and environmental problems.
Below is a brief overview of the main technologies for the extraction of unconventional gas, including shale gas, coalbed methane, methane gas hydrates and associated petroleum gas.
Shale Gas / Resources and Production
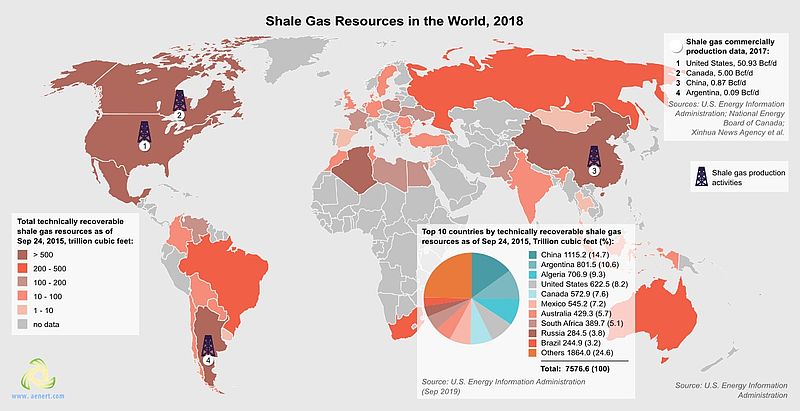
The most detailed state of shale gas resources by countries is given in the following fundamental sources [5, 10-11]. According to the authors, as of the last update (dated September 24, 2015), there are 7 576.6 Tcf in the world or about 215 Tcm of “Unproved technically recoverable resources” of shale gas, which is comparable to the global reserves of traditional natural gas (Fig. 1). Between the first (2011) and second (2013) issues of the «Technically Recoverable Shale Oil and Shale Gas Resources» [5,10], data on the resources of several countries were updated or added, including, for example, the resources of Egypt and Russia have been added, the resources of Venezuela, Algeria, Canada, Ukraine, India and Pakistan have significantly increased. In turn, the resources of Mexico, Poland, Libya and South Africa have decreased.
Fig. 6. Distribution of resources and volumes of shale gas production by countries of the world
![]() Shale_gas_resources_in_the_world_2018.pdf[551 kB]
Shale_gas_resources_in_the_world_2018.pdf[551 kB]
Source: World Shale Resource Assessments/Last updated: September 24, 2015/ U.S. Energy Information Administration (EIA), [11]
According to these sources, the largest (over 500 Tcf) reserves are found in China (1 115.2), Argentina (801.5), Algeria (706.9), the USA (622.5) and Canada (572.9). The top 10 countries in terms of shale gas reserves also include Mexico, Australia, South Africa, Russia and Brazil. A total of 46 countries are mentioned, of which 14 - European countries, 8 countries from Asia and Pacific and South Asia, 13 - Middle East and Africa, 8 - South America & Caribbean, and finally 3 from North America. Most of the shale gas resources are concentrated in North America - 1,685 and Asia and Pacific - 1,607 Tcf. In [5], detailed information is presented on 137 shale formations and prospective shale basins for most of those noted in Fig. 6 countries.
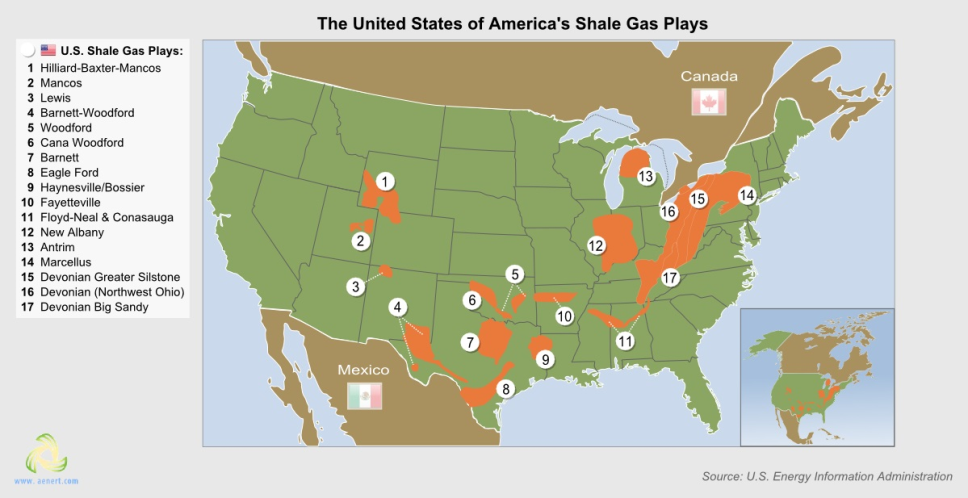
In detail, and most importantly, largely on the basis of real practice, shale gas resources have been investigated in the United States. A simplified map of the main shale plays of the USA is presented in fig. 7 based on [12]. It also provides data on resources, active basin areas, shale layer depth and rock porosity, as well as lists of companies involved in the exploration and production of shale gas.
Fig. 7. Shale Gas Plays in the United States of America
Name:Hilliard-Baxter-Mancos
U.S. state: Wyoming and Colorado
Resources: 4 trillion cubic feet
Active area: 16 416 sq. miles
Depth: 14 750 ft
Porosity: 4,25%
Active companies (gas zone holders):
- Anadarko Petroleum;
- Devon Energy;
- Kodiak Oil & Gas;
- Questar;
- Ultra Petroleum.
Name:Mancos
U.S. state: Utah
Resources: 21 trillion cubic feet
Active area: 6589 sq. miles
Depth: 15 250 ft
Porosity: 3,5%
Active companies (gas zone holders):
- Anadarko Petroleum;
- Berry Petroleum;
- Cabot Oil & Gas;
- Chesapeake;
- Comstock;
- Cubic Energy;
- Devon Energy;
- El Paso;
- EnCana Corp.
Name:Lewis
U.S. state: New Mexico
Resources: 12 trillion cubic feet
Area: 7506 sq. miles
Depth: 4500 ft
Porosity: 3,5%
Active companies (gas zone holders):
−
Name:Barnett-Woodford
U.S. state: Texas
Resources: 32 trillion cubic feet
Active area: 2691 sq. miles
Depth: 10 200 ft
Porosity: −
Active companies (gas zone holders):
- Abraxas;
- Carrizo Oil & Gas;
- Chesapeake;
- Continental Resources;
- EnCana Corp.;
- Quicksilver;
- Range Resources;
- TXCO Resources.
Name:Woodford
U.S. state: Oklahoma
Resources: 22 trillion cubic feet
Western/Central area: 2900/1800 sq. miles
Western/Central depth: 9500/5000 ft
Western/Central porosity: 7/6%
Active companies (gas zone holders):
- Chesapeake Energy;
- Cimarex;
- Continental Resources;
- Devon Energy;
- Linn Energy;
- Newfield Exploration;
- Penn-Virginia;
- PetroQuest;
- Range Resources;
- St. Mary Land & Exploration;
- Williams Cos.;
- Unit Corporation;
- XTO Energy.
Name:Cana Woodford
U.S. state: Oklahoma
Resources: 6 trillion cubic feet
Active area: 688 sq. miles
Depth: 13 500 ft
Porosity: 7%
Active companies (gas zone holders):
- Devon Energy;
- Continential Resources;
- Cimarex;
- Questar Resources.
Name:Barnett
U.S. state: Texas
Resources: 43 trillion cubic feet
Active area: 4075 sq. miles
Undeveloped area: 2383 sq. miles
Depth: 7500 ft
Porosity: 5%
Active companies (gas zone holders):
- Carrizo Oil & Gas;
- Chesapeake;
- Devon Energy;
- EnCana Corp.;
- EOG Resources;
- Quicksilver;
- Parallel Petroleum;
- Range Resources;
- Williams Cos.;
- XTO Energy;
- Denbury;
- Forest Oil;
- Petroleum Development.
Name:Eagle Ford
U.S. state: Texas
Resources: 21 trillion cubic feet
Dry gas area: 200 sq. miles
Condensate area: 890 sq. miles
Depth: 7000 ft
Porosity: 9%
Active companies (gas zone holders):
- EOG Resources;
- Swift Energy.
Active companies (condensate zone holders):
- Comstock;
- EOG Resources;
- Murphy Oil Corporation;
- Petrohawk Energy Corporation;
- Pioneer Natural Resources;
- Rosetta Resources;
- Talisman.
Name:Haynesville/Bossier
U.S. state: Texas and Louisiana
Resources: 75 trillion cubic feet
Active area: 3574 sq. miles
Undeveloped area: 5426 sq. miles
Depth: 12 000 ft
Porosity: 8,5%
Active companies (gas zone holders):
- Anadarko Petroleum;
- Berry Petroleum;
- Cabot Oil & Gas;
- Chesapeake;
- Comstock;
- Cubic Energy;
- Devon Energy;
- El Paso;
- Encana Corp.;
- Encore Acquisition;
- EOG Resources;
- EXCO Resources;
- Forest Oil;
- GMX Resources;
- Goodrich Petroleum;
- Noble Energy;
- Penn-Virginia;
- Petrohawk;
- Plains Exploration & Production;
- Questar;
- SandRidge;
- St. Mary Land & Exploration;
- Unit Corp.;
- XTO Energy.
Name:Fayetteville
U.S. state: Arkansas
Resources: 32 trillion cubic feet
Active area: 9000 sq. miles
Depth: 4000 ft
Porosity: 5%
Active companies (gas zone holders):
- Carrizo Oil & Gas;
- Chesapeake Energy;
- Edge Petroleum;
- Penn-Virginia;
- PetroHawk;
- PetroQuest;
- Southwestern Energy;
- Storm Cat Energy;
- XTO Energy.
Name:Floyd-Neal & Conasauga
U.S. state: Alabama and Mississippi
Resources: 4 trillion cubic feet
Active area: 2429 sq. miles
Depth: 8000 ft
Porosity: 1,6%
Active companies (gas zone holders):
- Anadarko Petroleum;
- Carrizo Oil & Gas;
- Chesapeake Energy;
- Edge Petroleum;
- Energen;
- HighMount E&P LLC;
- Murphy Oil;
- Range Resources.
Name:New Albany
U.S. state: Illinois, Indiana, Kentucky
Resources: 11 trillion cubic feet
Active area: 1600 sq. miles
Undeveloped area: 41 900 sq. miles
Depth: 2750 ft
Porosity: 12%
Active companies (gas zone holders):
- BreitBurn Energy Partners;
- Carrizo Oil & Gas;
- CNX Gas;
- Continental Resources;
- El Paso;
- Forest Oil;
- NGAS Resources;
- Noble Energy;
- Rex Energy.
Name:Antrim
U.S. state: Michigan
Resources: 20 trillion cubic feet
Active area: 12 000 sq. miles
Depth: 1400 ft
Porosity: 9%
Active companies (gas zone holders):
- Atlas Energy Resources LLC;
- BreitBurn Energy Partners;
- HighMount E&P LLC;
- Whiting Petroleum.
Name:Marcellus
U.S. state: Maryland, New York, Ohio, Pennsylvania, Virginia, West Virginia
Resources: 410 trillion cubic feet
Active area: 10 622 sq. miles
Undeveloped area: 84 271 sq. miles
Depth: 6750 ft
Porosity: 8%
Active companies (gas zone holders):
- Anadarko Petroleum;
- Atlas Energy Resources LLC;
- Cabot Oil & Gas;
- Carrizo Oil & Gas;
- Chesapeake;
- CNX Gas;
- Dominion;
- Equitable Resources;
- EXCO Resources;
- Penn-Virginia;
- Petroleum Development;
- Range Resources;
- Rex Energy;
- Quest Energy Partners L.P.;
- Talisman;
- Ultra Petroleum;
- Unit Corp.;
- XTO Energy.
Name:Devonian Greater Siltstone
U.S. state: New York, Pennsylvania, Ohio, West Virginia, Virginia
Resources: 8 trillion cubic feet
Area: 22 914 sq. miles
Depth: 2911 ft
Porosity: 5,8%
Active companies (gas zone holders):
−
Name:Devonian (Northwest Ohio)
U.S. state: New York, Pennsylvania, Ohio, Kentucky, Tennessee, West Virginia
Resources: 14 trillion cubic feet
Area: 45 844 sq. miles
Depth: 3000 ft
Porosity: 7%
Active companies (gas zone holders):
−
Name:Devonian Big Sandy
U.S. state: Pennsylvania, West Virginia, Virginia, Kentucky
Resources: 7 trillion cubic feet
Active area: 8675 sq. miles
Undeveloped area: 1994 sq. miles
Depth: 3800 ft
Porosity: 10%
Active companies (gas zone holders):
- Cabot Oil & Gas;
- Chesapeake Energy;
- CNX Gas;
- Dominion;
- Equitable Resources;
- EXCO Resources;
- GeoMet;
- NGAS Resources;
- Penn-Virginia;
- Range Resources.
The largest amounts of shale gas resources are concentrated in the Northeast of the country. So, in the Marcellus field, it is expected to have more than 400 trillion cubic feet, another 14 Tcf in Northwest Ohio, 20 Tcf in Antrim Shale Gas Play, etc. Other leading regions include Fayetteville (Mid-Continent) - 32, Barnett (Southwest) - 43, Haynesville (Gulf Coast) - 75, all in Tcf.
China, which is a world leader in shale gas reserves, according to [5] has seven main most promising shale gas and oil basins - Junggar (north-western China), Tarim (western China), Songliao (north-eastern China), Sichuan, Jianghan (southern China), Subei and Yangtze Platform (southeast China). According to the authors, the most saturated technically recoverable shale gas reserves are the Sichuan regions - more than 600 Tcf and Junggar - more than 200 Tcf. [5] provides detailed geological data for each basin. For example, in the Sichuan basin for the main formations, the prospective area is about 37,000 mi2, average depth from 9700 to 13200 ft, thickness from about 300 to 1000 ft.
In Argentina, the second largest shale gas country in the world, according to [5], several large promising basins have been identified. Among them are Parana (northeast Argentina), Neuquen (central west), San Jorge and Austral-Maqgallanes (south). The most studied of all is the Neuquen basin from the Vaca Muerta Shale Formation. Here, the prospective area for the dry gas production zone is about a little more than 3500 mi2, average depth - 8000 ft, thickness - 500 ft. Risked Recoverable Dry Gas - 193.5 Tcf.
Currently, shale gas is produced commercially in four countries - the United States, Canada, China and Argentina (Fig. 6). As mentioned above, in the United States shale gas production in the last decade has been growing at an enormous rate (Fig. 3) and reached 23.55 Tcf in 2018, which amounted to more than 63% of the total gas production in the country [13-14]. The most productive regions during this period were primarily in the East (Marcellus, Utica), as well as the Southwest (Woodford, Barnett) and Gulf Coast (Permian, Eagle Ford, Haynesville) and others [15]. In recent years, commercial shale gas production has increased substantially in several relatively new formations - Burket and Geneseo, located in Pennsylvania and West Virginia (located under the Marcellus shales) and Turner, Frontier and Sussex-Shannon in Wyoming. In 2017, production levels recovered at the Haynesville shale play [16]. It is predicted that this pool, along with Marcellus and Utica (Appalachian) will drive total U.S. production in the long term [17].
The prospects for natural gas production are discussed in detail in the Annual Energy Outlook by U.S. Energy Information Administration, including for 2019 [14], as well as in related publications of this organization, for example, [18]. In [14], for the most favourable scenario (High Oil & Gas Resource and Technology), the total volume of natural gas production in the USA could reach significantly more than 50 Tcf by 2050, and in the worst case (Low Oil & Gas Resource and Technology) a little more than 30 Tcf. When implementing the Reference option, production will significantly exceed 40 Tcf. In all cases the dominant contribution will be provided by gas production from shale and tight rocks.
The prospects for growth in shale gas production in the United States are often questioned in the press. The main arguments here are usually: high capital costs for the organization of shale oil production, a reduction in the number of drilling rigs, and a lack of a resource base [19-21]. Jean Laherrere in [19] sharply criticized the optimistic forecasts of U.S. Energy Information Administration for oil and gas, arguing that by 2040 gas production will reach 20 Tcf at best, and not 40, as predicted by the EIA, since by this time resources will be substantially depleted and market prices will fall. In [21], it was noted that the ratio of capital expenditures and cash flow ratio for shale companies is extremely unsatisfactory (early 2017), which inevitably leads to a decrease in production. In [22], the author recalls the history of cyclic processes and the prediction of Peak oil, which were pushed back by the development of unconventional oil production.
Nevertheless, US hydrocarbon production continues to grow steadily. Thus, from January to December 2018, the monthly production of shale gas increased from 1,847.934 Bcf to 2,133.908 Bcf (an increase of more than 15%) [9]. According to the conclusions of [23], the supply of shale products in the United States will continue to grow even in the face of lower world prices. It is also noted here that despite a decrease in the total number of horizontal drilling rigs (according to [24]) and a decrease in investment, most mining companies have gained additional resistance to market fluctuations and increased production efficiency. This was confirmed in the second half of 2019, when an intensive increase in oil production from shale [25-26] began to the expected level of 16% higher than the previous year. At the same time [27] in the middle of 2019, a significant event occurred when shale operators (based on the financial indicators of 40 companies) for the first time in a three-month period generated a positive cash flow after accounting for capital expenditures.
However, this euphoria was short-lived, since six months later gloomy prospects were again presented based on the financial indicators of the US shale industry for the third quarter of 2019 [28]. This analysis reports that despite continued production growth in the third quarter, negative cash flow again formed among major public oil and gas companies to the amount of $1.26 billion, crossing out the positive trend in the second quarter of 2019. Chesapeake Energy, Diamondback Energy and EQT showed particularly impressive negative data. Of course, this is significantly less than the results of the first quarter, when negative cash flow reached almost $3 billion, and even more hopeful if we compare the results with the second quarter, when it was positive.
According to former EQT Corp. CEO Steve Schlotterbeck [29], if the industry wants to survive, it needs to radically change the behaviour towards investors, by reducing production to demonstrate positive financial results.
It is obvious that the next five years will become extremely important for the US shale industry, however, the accumulated experience, the flexibility of the technologies used and the export opportunities that have appeared in the country suggest that the current crisis will be overcome.
Forecast data on shale gas production in other countries are given in [18]. It is noted that in addition to the United States, by 2040, shale gas will be produced in China, Canada, Argentina, Mexico and Algeria. Production growth in China will be particularly impressive, and may exceed 20 Bcf per day. Currently, the production of unconventional types of gas (synthetic natural gas, coalbed methane, shale and tight gas) in China is about 41% of the total production [30], and from 2010 to 2018 it has increased by more than five times. Production is mainly carried out in the Sichuan basin by two state-owned companies - CNPC PetroChina and China Petroleum and Chemical Corporation (Sinopec), which have obligations to increase production by 2020 to 1.16 Bcf per day and 0.97 Bcf per day, respectively, which is equivalent to doubling the level of production in 2018 [30].
Since 2008, shale gas has been successfully produced in Canada (4.1 Bcf per day in 2015 [18]). In recent years, shale gas production in Argentina has significantly increased, which allowed the country to resume export pipeline deliveries. In December 2018, production from the main shale region Vaca Muerta exceeded 1.0 Bcf per day [31].
In Mexico, shale gas production can be launched at Burgos Basin, where Mexico’s national energy ministry (SENER) issued permission to conduct exploration and private investment in the region [32].
The most problematic region for the development of shale production turned out to be Europe, where the use of hydraulic fracturing that underlies shale production is either expressly prohibited or significantly limited (France, Bulgaria, Switzerland, Germany, the Czech Republic) or suspended for commercial and organizational reasons (Lithuania, Poland, Romania) [33]. The resource base of shale gas and oil in Europe, as well as production prospects and environmental problems are discussed in detail in [34–36]. A decade ago, these prospects looked promising, especially in Poland, but these hopes were not realized. The reasons for this were primarily significant differences in the structure of shale rocks, which require significant optimization of exploration and production, administrative and organizational barriers, as well as a powerful environmental lobby that advocates the prohibition of fracking technologies. This confrontation was especially dramatic in the UK, where it seemed that the extraction of shale resources would finally take place on a commercial scale for the first time in Europe.
Fig 8-9. Fracking in UK/The UK government has announced a ban on fracking – November 2019
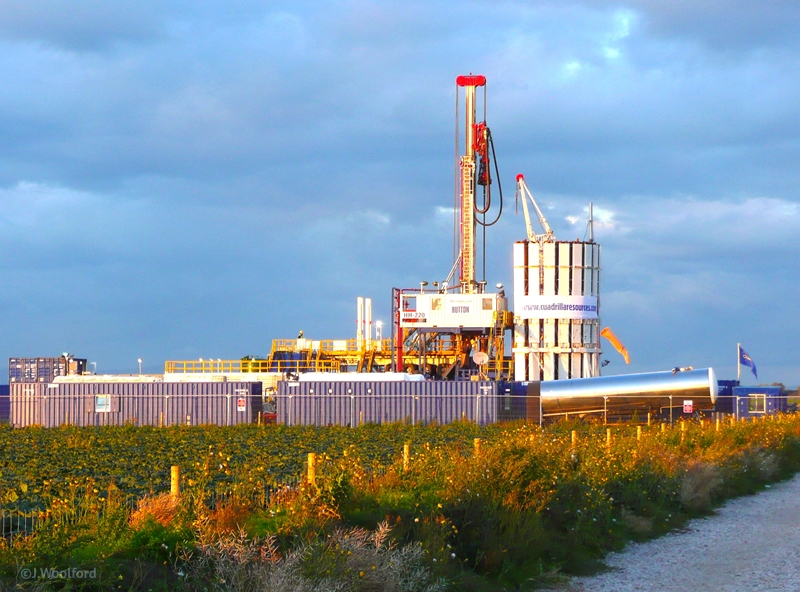

Photos: Justin Woolford
However, finally, at the end of 2019, the UK government was forced to introduce a moratorium on fracking after the publication of studies on the risks of earthquakes caused by fracking [37-39].
Shale Gas / Mainstream technologies, advantages and disadvantages
Hydrocarbons in low-permeable shale rocks, unlike oil and gas-rich natural reservoirs, are located on a much larger area and, lacking mobility, are clogged in relatively small cavities. The permeability of gas-saturated shale rocks is often below a threshold value of 0.1 millidarcy [40]. To ensure the extraction of hydrocarbons from such rocks, at least two additional measures are required: to increase the contact area of the well with the gas-containing formation and to increase the permeability of the rock. Since the thickness of shale gas-bearing formations is usually small and averages from 300 to 1000 ft, conventional vertical wells cannot provide sufficient productivity and are quickly depleted. Therefore, to implement the first of the tasks - to increase the area of contact between the well and the gas-containing formation - horizontal directional drilling technology was developed and successfully applied. With this configuration of the well, especially if there are several of them and if they are located inside the gas-bearing layer, satisfactory area of contact with the gas-containing formation is achieved. For hydrocarbon production, it is necessary to increase the permeability of the rock, or in other words, to create a network of collapse-resistant cracks in it, through which oil and gas can migrate to the surface of the well, and then to the surface of the earth. To do this, hydraulic fracturing is used, which is the injection of a special fluid containing surfactants into the well that contribute to the formation of cracks and solid particles, on the contrary, to prevent healing of cracks and subsequent hydraulic shock, i.e. instant build-up of fluid pressure in the well and through special holes in it in the contact part of the rock, leading to its cracking (Fig. 10).
Fig. 10. A simplified scheme for the production of hydrocarbons from shale layers
-

Scheme of hydrocarbon production from shale formations -

1. Drilling.
2. Well cementing.
3. Small fractures are created.
4. Water tank.
5. Chemical storage.
6. Frac fluid is injected.
7. Freshwater pit.
8. Natural gas flows into well.
9. Holding tanks.

Despite the apparent simplicity of the process, keeping in mind that it should be carried out underground, at great depths and in layers of relatively small thickness, we are talking about an exceptional engineering breakthrough, technologies that are similar in nature to surgical or jewellery operations. Here, at each stage, knowledge of a large number of related disciplines is required, from purely technical, for example, simple (or vice versa, not simple) fittings, shut-off valves and flexible hoses that can withstand hydraulic shock and not collapse faster than rock, to chemical fillers and cracking bases in materials science. More detailed information about fracking for different levels of understanding, including historical information, video resources, and major equipment suppliers, can be found, for example, in [40–46]. Additional important information about this process is presented in [46] or on the websites of the main developers of this technology - the American companies Halliburton and Schlumberger [47-48].
Various drilling sensors, special tools, for example, whipstocks, bottomhole, drill bits, turbodrills turbines, drilling mud motors, have been widely used to implement Directional Drilling. Maintaining the bending radius of the borehole pipe and its diameter (usually at least 100 ft radius per 1-inch of pipe diameter) or diameter-to-wall thickness ratio (D / T) is important. Modern directional drilling technologies in their configuration contain rotary steerable systems and sophisticated software that allows for accurate placement of wells and automate drilling processes [47]. Currently, directional drilling is widely used not only for the production of shale gas or oil, but to increase the production of traditional hydrocarbons. According to [49], in the USA the number of horizontal wells has steadily increased, and by 2018 had exceeded the number of vertical wells.
As already noted above, special fluids are used to ensure hydraulic fracturing. The requirements for them, as well as a list of the most frequently applicable, are contained in [36,50-52]. Hydraulic fracturing fluids are an environmental vulnerability of the technology, since many of them contain deleterious and toxic chemicals, so special attention is paid to the development of special harmless compounds. The selection of proppants is also important for hydraulic fracturing [53–55]. Their main function is to maintain the cracks formed during hydraulic fracturing in the open state. Thus, the proppants on the one hand should have high strength and hardness, and on the other hand, should easily move together with the fluid to the edges of the cracks during hydraulic fracturing. In addition, they must have a strict fractional composition. The proppant size is usually 0.1–2.38 mm [55]. Proppants are usually made of silica sand, which is much cheaper than other options, from ceramics (lightweight, intermediate density, high density ceramic proppant), as well as modified compositions, primarily resin coated proppants. According to [54], silicon proppants prevail in the US market, their share is 80%, polymer coated and ceramic proppants each have 10% of the market. In 2015, 37.5 million tons of this was used in the USA. The largest producer of ceramic proppants in the world is China [54].
In industrial practice, hydraulic fracturing is carried out by specialized service companies with their own staff of specialists and equipment. According to [56] in the USA, the effectiveness of such specialization has significantly increased in recent years, as evidenced by the increase in the number of fracked wells per active crew. This also indicates a high level of cooperation between various additional services - equipment suppliers, suppliers of consumables (proppants, fluids, pipes, etc.), repair services, etc.
The economic performance of drilling and natural gas production in the United States, including elements of horizontal drilling and hydraulic fracturing, are discussed in more detail in [57], which was prepared by IHS Global Inc. by order of U.S. Energy Information Administration. The total profitability of any production is always determined by the ratio on the one hand of the value of capital and operating costs, and on the other hand of external economic factors dictating the price of demand for products. The preamble to this publication notes that the availability of information on these costs is significantly lower compared to information on price and productivity dynamics and poses a certain problem, especially when it is necessary to carefully evaluate future market trends.
For typical U.S. onshore wells in the USA, in [57] five key cost categories were identified that define more than 75% of the total cost of drilling and completing wells. Among them, equipment costs, including frac pumps, account for the largest share, at about 24%. The remaining key costs are concentrated in a relatively narrow percentage range from 11 to 15% and include - Rig and drilling fluid, Casing and cement, Proppant, Completion fluids and flow back. The average drilling and completion costs for the five studied onshore plays (Eagle Ford, Bakken, Marcellus, Midland and Delaware) averaged $6 million per well, rising to almost $10 million per well in some years [57]. Directional drilling cost parameters are set at the following levels (by the end of 2018) - for Drilling Cost per Total Depth - $100-150 per foot and for Completion Cost per Lateral Foot - an average of about $500 per foot. More detailed information is presented in the appendix to [57] - IHS Oil and Gas Upstream Cost Study (Commission by EIA).
In [58], the costs of shale hydrocarbon production in the long term were studied based on modelling supply and demand scenarios, including the latest corrective U.S. Energy Information Administration (latest EIA cost data) data. According to the authors, production costs will remain moderate until 2040, and cost variation will range from $2.5 / MMBtu to $6.0 / MMBtu in 2040. This research also explains the significant gap in the cost of producing shale hydrocarbons in the United States and other regions of the world.
Publication [59] provides data on the cost of drilling for shale gas production in China in the Sichuan Basin. It was noted that by mid-2015, the average cost of drilling a horizontal well was between $11.3 – $12.9 million, with a significant downward trend in costs. The structure of shale gas well cost is as follows - drilling and completion 5.3, fracturing - 3.9, steel - 1.2, drilling and completion labour - 0.9, fracturing labour - 0.2 (all in million U.S. dollars).
The problem of resolving a large number of environmental claims is of crucial importance for the development of shale technologies, in particular fracturing. A general list of environmental impacts of hydraulic fracturing technologies can be easily found, for example, in [36, 37, 60]. High levels of fresh water consumption, groundwater pollution with hazardous chemicals, soil and surface water pollution with insufficiently efficient recycling of the injected fluid stand out among them. It should be noted here that when considering this list it is necessary to separate the general environmental problems of the extraction and use of fossil fuels and those specific ones that are directly related to the peculiarities of the production of shale hydrocarbons. In this sense it is hardly worth focusing on issues related to air emissions, such as methane, issues related to land use, personnel safety or climate change, since all this is no less inherent in the extraction of traditional fossil fuels. But the problems of using large volumes of water, various hazardous chemicals and inducing seismicity seem fair.
Increased water consumption during fracking is determined by the very essence of the technological operation, which is based on hydraulic action. According to [61], in the most developed shale region of the USA, Pennsylvania (Marcellus), the average consumption of water injected for hydrofracturing was 3 million gallons per well, sometimes reaching a maximum of 8.3 million gallons. Water brought onsite ranged from 30 to 100%, an average of 84%, and recovery of injected water averaged only 10%, sometimes rising to a maximum of 57%. According to the author of the article in [62], the expenses of the oil and gas industry for water supply can reach 15%, which is not often taken into account in the initial costs. This is one of the most pressing issues because treatment and disposal of large volumes of wastewater used after cracking is a very expensive operation. Moreover, the purification of recycled water is required not only due to the addition of proppants and chemicals, but also because many deposits contain heavy metals and naturally occurring radioactive materials [36]. The latter, however, is also characteristic of deposits of traditional hydrocarbons. Since most of the fields are far from existing treatment facilities, and often even in areas with minimal infrastructure, it is clear that the construction of additional treatment facilities is extremely undesirable for oil and gas companies, sometimes beyond the margins of project profitability. Obviously, one of the reasons for stopping shale production in Europe is precisely connected with this problem, or rather with the problem in the difference between the legislation on wastewater in the USA (where, in particular, its deep underground injection is allowed) and the EU, where wastewater treatment is always required by law [36]. The use of alternative fracking options with the substitution of water for, for example, liquefied petroleum gas and liquefied carbon dioxide, in addition to serious financial and technological problems, pose new environmental impact problems, including increased fire and explosion hazards or risk of significant carbon dioxide leaks [36]. Perhaps membrane cleaning technologies may have good prospects [64], especially if these are mobile service complexes.
All aspects of water supply in regions rich in shale resources were studied in detail in [63], as well as, for example, in [64-65]. Key disappointing findings from [63]: “38 percent of shale resources are in areas that are either arid or experiencing severe or extremely high water shortages; 19 percent are in areas with high or extremely high seasonal variability; and 15% are in places subject to severe or very severe drought”. The most problematic countries of the top twenty countries with large reserves of shale gas, according to [63], are Algeria, Libya, Egypt, which are assigned to the most problematic category Arid & Low Water Use. Reserves leader China, as well as Mexico, South Africa, and India are categorized as High water stress level, and Pakistan as Extremely high. Thus, almost half of the countries in the top twenty have or will have problems with the water supply of shale gas production processes. A similar picture emerged when considering regions rich in shale oil reserves. To protect groundwater from contaminated process water, there are sufficiently reliable technological methods, including special multilevel protection of the well with a steel casing and cement layers [64], therefore leakages are possible only in emergency cases in violation of technical regulations.
It is difficult to deny the influence of fracking on the indication of seismicity on the basis of several serious statistical facts set forth, for example, in [66]. However, it is apparently not yet possible to establish clear quantitative parameters for such an effect. In [66], it was demonstrated that between 2010 and 2013, an average of 100 earthquakes of magnitude 3.0 occurred in the middle and eastern parts of the United States, which is more frequent than between 1970 and 2000, when an average of 20 similar shocks were recorded yearly. The second fact noted by the researchers is that seismicity increased in the regions where wastewater was pumped into deep burial wells after hydrocracking. Finally, the third fact - an earthquake with a magnitude of 5.6 points that occurred in Oklahoma in 2011 - one of the factors of which was the removal of wastewater [66]. However, only a small number of over 30,000 wastewater discharges affect seismicity in the region. To manage emerging risks, U.S. Geological Survey researchers conducted the study of geological and other data to create a quantitative risk management model called "the traffic-light system". However, this will inevitably require a revision of the regulatory framework for wastewater disposal, aimed solely at protecting drinking water sources, but not at earthquake safety [66].
Obviously, the latest source of information on induced seismicity may be a study by the United Kingdom's Oil and Gas Authority (OGA), on the basis of which the UK government cancelled permissions for hydraulic fracturing operations [38–39]. Moreover, the reason for this was not so much the earthquakes themselves, but the impossibility to predict the scale of possible earthquakes.
Shale Gas / Research and innovations
The intensive development of shale gas production technologies over the past two decades has been accompanied by a significant increase in the number of granted patents and registered patent applications on this subject, and the geography of patenting countries is expanding, as well as the list of patented technological operations, equipment items and various substances. A statistical analysis of the patent activity of the two main shale gas mining operations - Directional Drilling and Hydraulic Fracturing can be of some interest. Below is a brief overview of patent activity regarding these operations based on an analysis of patent applications filed with the patent offices around the world over the past ten years (2009-2018).
In total, 22,727 documents were selected for consideration, in which one way or another, hydraulic fracturing was mentioned and 11,266 documents that are related to directional drilling operations. It should be noted that a large number of patent applications contain engineering solutions for both options, which is taken into account in statistical calculations. The general patent analysis methodology is available on the Advanced Energy Technologies website in the research and analysis section.
The total number of patent applications registered in the main patent offices of the world is presented in Fig. 11-12.
Fig. 11-12. Distribution of patent applications among the main patent offices of the world. Left - Directional Drilling, Right - Hydraulic Fracturing.
Source: Advanced Energy Technologies
In both cases, the largest number of patent applications was filed in the United States. The top ten also included WIPO, CNIPA (China), EPO, CIPO (Canada), IP Australia, IMPI (Mexico), INPI (Brazil), Rospatent (Russia) patent offices. IPO (Great Britain) and INPI (Argentina) entered the top 10 lists for Directional Drilling and Hydraulic Fracturing, respectively. Perhaps the main difference between the two diagrams is that a lot of patent applications are registered in the Chinese office related to the subject of Hydraulic Fracturing (second line in the list).
A substantially different picture emerges when considering the residency of applicants. As follows from fig. 13 and 14, the vast majority of patent applications were submitted by US residents - in 68% and 61%, respectively.
Fig. 13-14. The distribution of applicants by residency. Left - Directional Drilling, Right - Hydraulic Fracturing.
Source: Advanced Energy Technologies
Residents of China, Canada and the Netherlands were also quite active, and together with US residents, formed the three leaders in groups. For a patent selection related to Directional Drilling, the least non-residents were patented in the United States (19% of non-residents of the total number of applicants). In CNIPA (China) 75% of non-residents were patented, and in EPO, CIPO (Canada), IP Australia, IMPI (Mexico), INPI (Brazil), Rospatent (Russia) – from 85% to 100%.
Hydraulic Fracturing is characterized by approximately the same picture, however, in CNIPA (China) the number of non-residents was significantly smaller – only 31%.
The problems to which the patent solutions of the applicants were aimed in their patent applications are shown in Fig.15-16.
Fig. 15-16. Left - The main problems of patent applications on the subject of Directional Drilling. Right - The main problems of patent applications related to Hydraulic Fracturing.
AOP – administrative and organisational problems; EB – Ecological balance; EGWC - Energy, gas or water consumption; EPM– Environmental protection measures; HCEI – High CAPEX / Exploration and Infrastructure; HCEP– High CAPEX / Equipment production; HCG– High costs in general; HOOC– High OPEX / Operation and consumables; HORR– High OPEX / Repair and replacement; LEE - Low Efficiency / Exploration; LEG– Low efficiency in general; LEMP– Low efficiency / Main processes; LESP – Low efficiency / Secondary processes; UP– Unclear problem
Source: Advanced Energy Technologies
Both for the case of patent selection related to Directional Drilling and for Hydraulic Fracturing, the authors were most interested in the problems of low efficiency of the main processes (25.2% and 32.6%, respectively), as well as the high cost of operational processes, including repair and equipment replacement. For Hydraulic Fracturing, a significant number of applications were also on problems of maintaining the ecological balance.
The ratio of the technology elements of the full production chain of shale hydrocarbon production is given in table 1. The issues directly related to inclined drilling and hydraulic fracturing have an approximately equal share ratio of 26.6% and 26.3%.
Table 1. Distribution of shares of patent applications by elements of the technological chain of shale hydrocarbon production
| Technology elements | Average rating | Share, % | Total 2009-2018 |
|---|---|---|---|
| Drilling and well elements | 11.63 | 26.6 | 9959 |
| Ecology & safety | 9.36 | 0.7 | 266 |
| Exploration and site development | 9.89 | 5.1 | 1916 |
| Hydraulic fracturing equipment and methods | 11.51 | 26.3 | 9843 |
| Hydraulic fracturing / Other equipment, methods and materials | 10.46 | 11.9 | 4446 |
| Hydraulic fracturing materials / Propping agents | 9.76 | 7 | 2637 |
| Hydraulic fracturing materials / Recovery and utilization | 8.62 | 2.1 | 803 |
| Hydraulic fracturing materials / Working fluids | 10.5 | 14.3 | 5372 |
| Infrastructure | 5.33 | 0.1 | 43 |
| Production and additional stimulation | 10.15 | 4.6 | 1716 |
| Product treatment & transportation | 7.53 | 1.2 | 442 |
Source: Advanced Energy Technologies
However, a significant array of patent documents on fracturing relates to associated operations, materials and equipment, for example, propping agents, working fluids or recovery and utilization. A relatively small volume of documents refers to issues of exploration and site development (5.1%) and production (4.6%). Thus, over 80% of the total volume of patent applications classified as hydrocarbon production from low permeability reservoirs over 80% in one way or another refer to Directional Drilling and Hydraulic Fracturing.
The dominant position in the field of intellectual property for engineering solutions related to directional drilling and hydraulic fracturing is occupied by the American company Halliburton Energy Services, Inc. (Tables 2 and 3), the share of which, for example, for the Directional Drilling case exceeds 40% and 22% for Hydraulic Fracturing. Moreover, over the past 10 years, the dominance of this company has been significantly strengthened, and patenting has expanded to 16 external patent offices. A significant number of patent applications in the period under review were also filed by the Schlumberger group of companies and Baker Hughes Incorporated. US representatives prevail among the top 10 patenting leaders. Among others - residents from the Netherlands, Canada, the British Virgin Islands, France and China.
Table 2. Top 10 Applicants in the field of Directional Drilling
| Status | Country | Name | Average rating | Total 2009-2018 |
|---|---|---|---|---|
| Company | US | Halliburton Energy Services, Inc. | 12.8 | 4898 |
| Company | NL | Schlumberger Technology B.V. | 11.9 | 622 |
| Company | US | Baker Hughes Incorporated | 13.9 | 550 |
| Company | US | Landmark Graphics Corporation | 9.8 | 513 |
| Company | US | Schlumberger Technology Corporation | 13.3 | 402 |
| Company | CA | Schlumberger Canada Limited | 12.6 | 397 |
| Company | VG | Prad Research and Development Limited | 12.4 | 319 |
| Company | FR | Services Petroliers Schlumberger | 12.3 | 315 |
| Company | VG | Schlumberger Holdings Limited | 12.3 | 297 |
| Company | NL | Shell Internationale Research Maatschappij B.V. | 12.6 | 146 |
Source: Advanced Energy Technologies
Table 3. Top 10 Applicants in the field of Hydraulic Fracturing
| Status | Country | Name | Average rating | Total 2009-2018 |
|---|---|---|---|---|
| Company | US | Halliburton Energy Services, Inc. | 12.7 | 5206 |
| Company | US | Baker Hughes Incorporated | 13.8 | 1678 |
| Company | NL | Schlumberger Technology B.V. | 12.1 | 985 |
| Company | CA | Schlumberger Canada Limited | 13.1 | 619 |
| Company | US | Schlumberger Technology Corporation | 13.7 | 564 |
| Company | US | Dow Global Technologies, LLC | 12 | 523 |
| Company | US | Rohm and Haas Company | 11.3 | 506 |
| Company | FR | Services Petroliers Schlumberger | 12.6 | 424 |
| Company | VG | Prad Research and Development Limited | 12.6 | 406 |
| Company | CN | PetroChina Company Limited | 13.7 | 371 |
Source: Advanced Energy Technologies
In the examined patent selection, the most frequently encountered subgroups of the International Patent Classification are directly related to Directional Drilling and Hydraulic Fracturing: Е21В 43/26 Methods or apparatus for obtaining oil, gas, water, soluble or meltable materials or a slurry of minerals from wells .Methods for stimulating production ..by forming crevices or fractures; and C09K 08/62 Compositions for drilling of boreholes or wells; Compositions for treating boreholes or wells, e.g. for completion or for remedial operations .Compositions for stimulating production by acting on the underground formation and Compositions for forming crevices or fractures.
References
[1] Resources to Reserves/ Oil, Gas and Coal Technologies for the Energy Markets of the Future/ © OECD/IEA, 2013 International Energy Agency / www.iea.org/publications/freepublications/publication/Resources2013.pdf
[2] NATURAL GAS /INFORMATION/2016 edition DATABASE DOCUMENTATION / www.oecd-ilibrary.org/energy/natural-gas-information-2016_nat_gas-2016-en
[3] BP Statistical Review of World Energy 2019/ www.bp.com/en/global/corporate/energy-economics/statistical-review-of-world-energy.html
[4] GLOBAL RESOURCE POTENTIAL OF GAS HYDRATE – A NEW CALCULATION/Arthur H. Johnson/Hydrate Energy International/ Kenner, Louisiana UNITED STATES/ www.pet.hw.ac.uk/icgh7/papers/icgh2011Final00070.pdf
[5] Technically Recoverable Shale Oil and Shale Gas Resources: An Assessment of 137 Shale Formations in 41 Countries outside the United States/June 2013/ U.S. Energy Information Administration (EIA)/ www.eia.gov/analysis/studies/worldshalegas/archive/2013/pdf/fullreport_2013.pdf
[6] Unconventional Oil & Gas Production/ IEA ETSAP - Technology Brief P02/ May 2010/ iea-etsap.org
[7] Gas flaring data 2014-18/ NOAA/GGFR/ www.worldbank.org/en/programs/gasflaringreduction
[8] America's Natural Gas Revolution /A 'shale gale' of unconventional and abundant U.S. gas is transforming the energy market /by Daniel Yergin And Robert Ineson / Nov. 2, 2009/ The Wall Street Journal/ www.wsj.com/articles/SB10001424052748703399204574507440795971268
[9] Natural Gas Summary/ U.S. Energy Information Administration (EIA, 2019)/ www.eia.gov/dnav/ng/ng_sum_lsum_dcu_nus_a.htm
[10] World Shale Gas Resources:An Initial Assessment of 14 Regions Outside the United States/APRIL 2011 / U.S. Energy Information Administration EIA)/ www.eia.gov/analysis/studies/worldshalegas/archive/2011/pdf/fullreport.pdf
[11] World Shale Resource Assessments/Last updated: September 24, 2015/ U.S. Energy Information Administration (EIA) www.eia.gov/analysis/studies/worldshalegas/
[12] Review of Emerging U.S. Shale Gas and Shale Oil Plays/ July 2011/ U.S. Energy Information Administration (EIA)/ www.eia.gov/analysis/studies/usshalegas/pdf/usshaleplays.pdf
[13] Natural Gas Annual/With Data for 2018 | Release Date: October 31, 2019/U.S. Energy Information Administration (EIA) / www.eia.gov/naturalgas/annual/
[14] Annual Energy Outlook 2019/U.S. Energy Information Administration (EIA)/https://www.eia.gov/outlooks/aeo/
[15] EIA adds new play production data to shale gas and tight oil reports/TODAY IN ENERGY/ U.S. Energy Information Administration/February 15, 2019/ www.eia.gov/todayinenergy/detail.php
[16] Haynesville shale gas production increases to highest levels since end of 2013/TODAY IN ENERGY/U.S. Energy Information Administration/October 27, 2017/ www.eia.gov/todayinenergy/detail.php
[17] Future U.S. tight oil and shale gas production depends on resources, technology, markets/ TODAY IN ENERGY/U.S. Energy Information Administration/August 22, 2016 / www.eia.gov/todayinenergy/detail.php
[18] Shale gas production drives world natural gas production growth/TODAY IN ENERGY/U.S. Energy Information Administration/August 15, 2016/ www.eia.gov/todayinenergy/detail.php
[19] Forecasts for US oil and gas production/ Jean Laherrere/19March2018/ aspofrance.files.wordpress.com/2018/03/lahall19march.pdf
[20] The Coming Collapse Of U.S. Shale Oil Production/Steve St. Angelo/Sep 04, 2018/Investing.com/ www.investing.com/analysis/the-coming-collapse-of-us-shale-oil-production-200342005
[21] Shale Gas Is Not A Revolution/ Art Berman/ Forbes/Jul 5, 2017/ www.forbes.com/sites/arthurberman/2017/07/05/shale-gas-is-not-a-revolution/
[22] Peak oil, 20 years later: Failed prediction or useful insight?/UgoBardi/ Energy Research & Social Science, Volume 48, February 2019, Pages 257- 261/
www.sciencedirect.com/science/article/pii/S2214629618303207
[23] North American shale supply set to grow even if oil prices drop/ Rystad Energy/December 5, 2019/
www.rystadenergy.com/newsevents/news/press-releases/northamerican-shale-supply-set-to-grow-even-if-oil-prices-drop/
[24] North America Rig Count/Baker Hughes/ rigcount.bakerhughes.com/na-rig-count
[25] US fracking rate on the rise again/Rystad Energy/July 26, 2019/ www.rystadenergy.com/newsevents/news/press-releases/us-fracking-rate-on-the-rise-again/
[26] US shale shows impressive execution/ Rystad Energy/November 14, 2019/ www.rystadenergy.com/newsevents/news/press-releases/us-shale-shows-impressive-execution/
[27] US shale industry turns cash flow positive/ Rystad Energy/August 21, 2019/ www.rystadenergy.com/newsevents/news/press-releases/us-shale-industry-turns-cash-flow-positive/
[28] U.S. Fracking Sector Spills More Red Ink—Again/Cash Flow Remains Disappointing to Debt, Equity Investors/Clark Williams-Derry, IEEFA Energy Finance Analyst and Kathy Hipple, IEEFA Financial Analyst/November 2019/ ieefa.org/wp-content/uploads/2019/11/US-Fracking-Sector-Spills-More-Red-Ink-Again.pdf
[29] Former EQT CEO: Shale Gas Revolution an ‘Unmitigated Disaster’ for Investors/Oil & Gas 360/ July 1, 2019/ www.oilandgas360.com/former-eqt-ceo-shale-gas-revolution-an-unmitigated-disaster-for-investors/
[30] China adds incentives for domestic natural gas production as imports increase/TODAY IN ENERGY/U.S. Energy Information Administration/ OCTOBER 23, 2019/ www.eia.gov/todayinenergy/detail.php
[31] Growth in Argentina’s Vaca Muerta shale and tight gas production leads to LNG exports/TODAY IN ENERGY/ U.S. Energy Information Administration/July 12, 2019/ www.eia.gov/todayinenergy/detail.php
[32] Mexico’s shale-rich Burgos Basin opens to private investment for the first time/ TODAY IN ENERGY/ U.S. Energy Information Administration/ August 22, 2017/ www.eia.gov/todayinenergy/detail.php
[33] The Permanent Peoples’ Tribunal Session on Human Rights, Fracking and Climate Change/ APPENDIX 2 to Violations of Nature’s Rights Legal status of unconventional oil and gas extraction across the world/ earthlawyers.org/wp-content/uploads/2018/04/APPENDIX-2-Legal-Status-of-UOGE-across-the-world-31.03.18.pdf
[34] Overview of the current status and development of shale gas and shale oil in Europe/ European Unconventional Oil and Gas Assessment (EUOGA)/2016/
ec.europa.eu/jrc/sites/jrcsh/files/t3_overview_of_the_current_status_and_development_of_shale_gas_and_shale_oil_in_europe.pdf
[35] Shale Gas in Europe/ Brian Horsfield, Hans-Martin Schulz, Ingo Kapp/ GFZ German Research Centre for Geosciences,14473 Potsdam,Germany 14473 Potsdam,Germany/ www.searchanddiscovery.com/pdfz/documents/2012/10380horsfield/ndx_horsfield.pdf.html
[36] Shale Gas for Europe –Main Environmental and Social Considerations/A Literature Review/Boyan Kavalov and Nathan Pelletier/European Commission Joint Research Centre Institute for Environment and Sustainability/2012/ publications.jrc.ec.europa.eu/repository/bitstream/111111111/26691/1/lbna25498enn.pdf
[37] Frack Off/Extreme Energy Action Network/ frack-off.org.uk/extreme-energies/shale-gas/
[38] Shale gas fracking wasted ‘millions of taxpayers’ cash’, say scientists/ Robin McKie/ Sun 3 Nov 2019 08.13 / www.theguardian.com/environment/2019/nov/03/fracking-shale-gas-scientists-tories-earthquake
[39] UK government halts support for shale gas fracking/4th November 2019/ www.theengineer.co.uk/uk-government-halts-shale-gas-fracking/
[40] Shale Gas: A Global Resource/ Chuck Boyer Pittsburgh, Pennsylvania, USA, Bill Clark, Oklahoma City, Oklahoma, USA, Valerie Jochen College Station, Texas, USA, Rick Lewis Camron K. Miller Dallas, Texas/ Schlumberger 2011/ pdfs.semanticscholar.org/c9cc/1a6f9559a7f050b9c870e2bfe50b5980b6ac.pdf
[41] Natural Gas from Shale: Questions and Answers/U.S. Department of Energy/ www.energy.gov/sites/prod/files/2013/04/f0/complete_brochure.pdf
[42] Tight and shale gas technology/ www.shell.com/energy-and-innovation/natural-gas/tight-and-shale-gas/tight-and-shale-gas-technology.html
[43] Hydraulic fracturing / en.wikipedia.org/wiki/Hydraulic_fracturing
[44] 2015 HORIZONTAL DIRECTIONAL DRILLING GUIDE / trenchlesstechnology.com/pdfs/2015-hdd-sup.pdf
[45] Directional drilling/ en.wikipedia.org/wiki/Directional_drilling
[46] An overview of hydraulic fracturing and other formation stimulation technologies for shale gas production/ Joint Research Centre Institute for Energy and Transport/ Luca Gandossi/ 2013/ publications.jrc.ec.europa.eu/repository/bitstream/JRC86065/an%20overview%20of%20hydraulic%20fracturing%20and%20other%20stimulation%20technologies%20(2).pdf
[47] Halliburton/ www.halliburton.com/en-US/default.html
[48] Schlumberger/ www.slb.com
[49] Horizontally drilled wells dominate U.S. tight formation production/TODAY IN ENERGY/U.S. Energy Information Administration/June 6, 2019/ www.eia.gov/todayinenergy/detail.php
[50] List of additives for hydraulic fracturing/ en.wikipedia.org/wiki/List_of_additives_for_hydraulic_fracturing
[51] List of 78 Chemicals Used in Hydraulic Fracturing Fluid in Pennsylvania/Marcellus Drilling News/ June 30, 2010/ marcellusdrilling.com/2010/06/list-of-78-chemicals-used-in-hydraulic-fracturing-fluid-in-pennsylvania/
[52] CHEMICALS USED IN HYDRAULIC FRACTURING/ UNITED STATES HOUSE OF REPRESENTATIVES COMMITTEE ON ENERGY AND COMMERCE MINORITY STAFF/ APRIL 2011/ ecolo.org/documents/documents_in_english/gas-_Hydraulic-Fract-chemicals-2011-report.pdf
[53] Hydraulicfracturingproppants/ en.wikipedia.org/wiki/Hydraulic_fracturing_proppants
[54] Hydraulic fracturing proppants/ Vitor Campos /Ceramica 64(370):219-229 / April 2018/ www.researchgate.net/publication/324981761_Hydraulic_fracturing_proppants
[55] A comprehensive review on proppant technologies/ Feng Liang, Mohammed Sayed, Ghaithan A. Al-Muntasheri, Frank F. Chang, Leiming Li/ Petroleum 2 (2016) 26-39/ www.fractracker.org/a5ej20sjfwe/wp-content/uploads/2017/03/Aramco-proppant-tech.pdf
[56] Crew efficiency and experience boosting shale performance/ Rystad Energy/November 15, 2019/ www.rystadenergy.com/newsevents/news/press-releases/crew-efficiency-and-experience-boosting-shale-performance/
[57] Trends in U.S. Oil and Natural Gas Upstream Costs/ U.S. Energy Information Administration/March 2016/ www.eia.gov/analysis/studies/drilling/pdf/upstream.pdf
[58] Shale gas production costs: Historical developments and outlook/ Energy Strategy Reviews/Volume 20, April 2018, Pages 20-25/Mélodie Mistré, Morgan Crénes, Manfred Hafner/ www.sciencedirect.com/science/article/pii/S2211467X18300014
[59] Shale gas development in China aided by government investment and decreasing well cost/TODAY IN ENERGY/U.S. Energy Information Administration/ September 30, 2015/ www.eia.gov/todayinenergy/detail.php
[60] Environmental impact of hydraulic fracturing/ en.wikipedia.org/wiki/Environmental_impact_of_hydraulic_fracturing
[61] Water Withdrawals for Development of Marcellus Shale Gas in Pennsylvania/Penn State Extension/august 14, 2009/ extension.psu.edu/water-withdrawals-for-development-of-marcellus-shale-gas-in-pennsylvania
[62] These are some of the industries threatened by the world’s water crisis. How can investors protect assets?/Andrew Harmstone/sep. 18, 2019/Morgan Stanley/ www.morganstanley.com/ideas/the-worlds-water-crisis-and-industries-at-risk
[63] Global Shale Gas Development: Water Availability & Business Risks/PAUL REIG, TIANYI LUO, AND JONATHAN N. PROCTOR/World Resources Institute/ wriorg.s3.amazonaws.com/s3fs-public/wri14_report_shalegas.pdf
[64] A New Sustainability Challenge: Water Management in Unconventional Shale Oil & Gas Operations Meeting Emerging Needs of the Water-Energy Nexus Examination of Key Issues by The Dow Chemical Company/ www.dupont.com/content/dam/dupont/amer/us/en/water-solutions/general/documents/177-03526.pdf
[65] EPA's Study of Hydraulic Fracturing for Oil and Gas and Its Potential Impact on Drinking Water Resources/United States Environmental Protection Agency/ www.epa.gov/hfstudy
[66] Man-Made Earthquakes Update/William Ellsworth, Jessica Robertson, and Christopher Hook /January 17, 2014/U.S. Geological Survey/ archive.usgs.gov/archive/sites/www.usgs.gov/blogs/features/usgs_top_story/man-made-earthquakes/index.html
Photo gallery
")
")
")
")


")
")


")
")
")
")
")


")
")
")
")
")
 - Porto de Pecem, Brazil (A)")
 - Porto de Pecem, Brazil (B)")

")
")
")
")
")
")

, (A)")
, (B)")
, (C)")
")
")


")
")
")