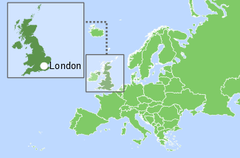
英国,正式名称为大不列颠及北爱尔兰联合王国,是位于欧洲大陆西北部不列颠群岛的一个国家。它的首都是伦敦。该国由英格兰、苏格兰、北爱尔兰和威尔士组成。该国东南海岸通过英吉利海峡下的隧道与欧洲大陆相连。该国可通往北海、爱尔兰海、凯尔特海和赫布里底群岛。
根据2022年的统计数据,英国领土面积居世界第85位,拥有约6800万人口。就人口密度而言,该国在 248 个国家中排名世界第 52位[1,2,3]。该国海岸线总长度为12,429公里[3]。政体为议会君主立宪制,官方语言为英语[3]。
| the United Kingdom | ||
|---|---|---|
| Capital: London | Density: 240.7/km2 | Currency: Pound sterling[f] (GBP) |
| Official languages: English | Life expectancy at birth: 80.90 years | GDP (PPP): $3.871 trillion (2023 est.) |
| National Day: - | Area: 242,495 km2 | GDP - per capita (PPP): $56,835 (2023 est.) |
| Population: 66,971,411 (2022 est.) | Coastline: 12,429 km | Internet country code: .uk |
Source: [1,2,3,4,5]
| Sources: 1. GDP (purchasing power parity), 2020 est. / The World Factbook/Library/Central Intelligence Agency *228 2. GDP - per capita (PPP), 2020 / The World Factbook/Library/Central Intelligence Agency *229 3. Inflation rate (consumer prices), 2019 est. / The World Factbook/Library/Central Intelligence Agency *228 4. Charges for the use of intellectual property, receipts (BoP, current US$), 2020 / International Monetary Fund, Balance of Payments Statistics Yearbook, and data files. / License: CC BY-4.0 *88 5. The Global Competitiveness Index 2019 / Rankings / Reports / World Economic Forum *141 6. High-technology exports (current US$) 2019-2020 / United Nations, Comtrade database through the WITS platform / License: CCBY-4.0 / Data *134 7. 2021 Index of Economic Freedom / International Economies / The Heritage Foundation *178 8. Reserves of foreign exchange and gold, 2017 est. / The World Factbook / Library / Central Intelligence Agency *195 9. Annual average GDP growth in %, for the last 10 years (2011-2020) / World Bank national accounts data, and OECD National Accounts data files / License: CC BY-4.0 *206 10. Public debt (% of GDP), 2017 est. / The World Factbook / Library / Central Intelligence Agency (from smallest to largest) *210 * Total number of countries participating in ranking 图 1. 英国经济指数 |
就选定的经济指标而言,该国高于世界平均水平,位于图表的前四分之一(即在评级中列入世界表现最好的国家的 25% 之列)。
从 20 世纪 90 年代初开始,该国的购买力平价 GDP 持续增长,无论是总体还是人均 [4,5]。按购买力平价计算的GDP从2017年的2.88万亿美元增加到2019年的3.101美元(世界第10位)[3]。该国按购买力平价计算的人均 GDP 大幅较低( 2020 年排名世界第 40),一直呈现出负面动态:从 2018 年的 46,000 美元下降到 2020 年的 41,600 美元[3]。
英国的通胀水平从2017年的2.6%升至2019年的1.7%。就该指标而言,该国排名世界第97位[3]。
根据世界经济论坛发布的《2020 年全球竞争力报告》,英国排名第 9 位( 在估计总共 141 个国家中),比去年下降了一位排名,落后于瑞士、荷兰、德国和瑞典在欧洲。除了一些经济指标外,该指数还考虑了教育、健康和创新水平等变量。
在2019-2020年高新技术产品出口国家排行榜中,中国排名第13位,高于世界平均水平,在欧洲仅次于德国、法国和荷兰。根据以商业自由、不受政府行为影响、财产保护和反腐败为基础的 2021 年经济自由指数,该国在178 个国家中排名第7。就黄金储备和外汇储备而言,2017年英国排名第18位,落后于德国、法国和意大利。
根据过去10年(2011-2020年)平均GDP增长率百分比指标,2020年英国在206个国家中排名第168位。就公共债务占国家 GDP 的百分比而言,2017 年英国在 210 个国家中排名第 29位。
英国石油公司 (BP plc.)、森特理克 (Centrica) 等多家英国能源公司跻身全球顶级跨国公司之列,同时跻身最大能源公司之列——标普全球普氏能源资讯 2021 年 250 强公司。
英国不拥有大量化石能源(表 1)。石油和天然气探明储量分别居 世界第33位 和第46位[3]。根据2021年数据,以吨油当量计算,石油探明储量为65.3%,天然气为31.2%,煤炭为3.5%(图5)。非常规化石资源矩阵看起来有些不同——(EIA – 2021年12月)页岩气储量占50.4%,油页岩(干酪根)——40%,页岩(致密)油——7.1%,伴生气——1.7%,石油砂和超重油——0.8%,煤矿瓦斯利用潜力——0.1%(图7)。
根据[3,6],截至 2021 年初,英国石油储量估计约为 25 亿桶,根据[11] – 2.0 bboe(已证实)和 3.1(可能)。
根据[3],英国的天然气探明储量为180.6 bcm(2021年),根据[6] - 200 bcm(2020年),根据[11] - 0.8 bboe(已探明)和1.3(可能) )。
表1. 英国化石能源资源
| Resource/ Explanations | Crude oil* | Natural Gas* | Coal | Shale Gas** | Tight Oil** | Coal mine methane | Oil Sands | Oil | Associated |
|---|---|---|---|---|---|---|---|---|---|
| Value | 2.5(0.15%) | 6.38(0.09%) | 29 | 25.8 | 0.7 | 0.3-1.73 | 76 | 3.500 | 643 |
| Unit | billion barrels | Tcf | million short tons | Tcf | billion barrels | Bcm | million barrels | million barrels | Bcf |
| Year | 2021 | 2020 | 2021 | 2015 | 2015 | 2018 | 2008 | 2008 | 2020 |
| Source | [19] | [19] | [19] | [8] | [8] | [6,7] | [9] | [10] | [11] |
*括号内提供了该国储量占世界总储量的份额
**未经探明的技术可采性
***储量
****原地资源
*****1P
据BP称,2020年底天然气储量为6.6 Tcf,煤炭探明总储量为2600万吨[6]。根据Advanced Energy Technologies公司计算,根据煤矿开采甲烷排放量[7]和2018年储量[6]计算,甲烷利用潜力为0.3-1.73 Bcm。根据 2015 年的数据,按照地区标准,英国页岩气储量较小 — 25.8 Tcf,页岩油储量 — 7 亿桶 [8]。欧洲国家中页岩气储量方面,英国大幅逊色于禁止开采的法国,略逊于荷兰。截至2008年底,超重油和沥青油资源量估计为7600万桶[9],干酪根油资源量为35亿桶[10]。截至2020年,油田伴生气探明储量(1P)为643 Bcf [11]。
英国由于其地理位置而拥有多种可再生能源用于能源生产。表2列出了此类资源的基本指标选择。
表2. 英国的可再生能源资源
| Resource/ Explanations | Solar Potential (GHI)* | Wind Potential (50 м)* | Hydro energy Potential** | Bio Potential (agricultural area) | Bio Potential (forest area) | Municipal Solid Waste |
|---|---|---|---|---|---|---|
| Value | 2.4–3.0 | 8.0–8.7 | 41 | 71 | 11.9 | 463 |
| Unit | kWh/m2/day | m/s | GWh/year | % of land area | % of land area | kg per capita |
| Year | 2018 | 2018 | 2016 | 2018 | 2018 | 2020 |
| Source | [12] | [13] | [14] | [16] | [17] | [18] |
* 适用于该国大部分领土
** 总理论能力
全国大部分地区的全球水平辐射水平为2.4-3.0 kWh/m 2 /天[12];该国南部和沿海地区的太阳辐射水平略高,为 3.0-3.3 kWh/m 2 /天 [12]。
英国的主要可再生资源是风力发电。根据这一指标,英国是全球最有发展风电前景的国家之一。陆地风资源分布如下:全国大部分地区风速为8.0-8.7 m/s[13],而苏格兰西北部近海地区风速可达9.75 m/s。位于 50 米高处。英国的理论水电总容量为 4.1 吉瓦/年 [14]。该国西海岸的波浪能潜力每年可达25-60 kW/m [15]。(图9)。这是该国主要的可再生能源,大多数其他国家无法获得。
英国约 71% 的土地被农业用地覆盖 [16],但在过去的半个世纪里,农业用地的面积一直在稳步下降。与此同时,森林面积略有增加,达到11.9%,而1990年为11.5%[17]。
2020 年,英国人均城市垃圾产生量为 463 公斤。例如,这个数字低于意大利(每人 487 公斤)和法国(每人 538 公斤)。这种资源是回收或能源生产的宝贵原材料,这些技术在英国已达到高水平的发展。
根据《2022年世界能源统计回顾》,2021年英国一次能源消耗量为7.18艾焦耳,其中天然气占主导地位——38.6%,其次是石油——34.8%,可再生能源——17.3%,核能——5.7% ,煤炭 – 2.9%,水电 – 0.7% [6]。
使用[3,6]中的数据,我们计算出英国 2020 年 GDP 能源强度的估计值为 16.3 美元,同时考虑到 2011 年每单位能源消耗的购买力平价价格(相当于一公斤所含能源)石油),高于世界平均水平。
由于北海储量严重枯竭,英国石油产量在2001年至2014年期间一直在稳步下降,但在2015年趋于稳定,2020年为1,095桶/日。同期石油消费量下降幅度也明显较小,2020 年为 121.5 万桶/天 [19]。过去十年来,英国的石油消费量一直超过其生产量,而且赤字不断增加。
根据BP的报告,2021年该国石油产量为87.4万桶/日,消费量为127.1万桶/日[6]。根据商业、能源和工业战略部的数据,2017年英国初级石油产量为5090万吨油当量,英国最终石油消费量为6390万吨油当量。2021年英国石油产量降至约4400万吨[20]。
2018年英国石油进口量为891,700桶/日,出口量为818,200桶/日[3]。根据[20],挪威仍然是英国的主要石油供应国,占原油进口总量的36%,其余由OPEC国家供应。石油产品由荷兰供应给该国。尽管石油产量下降,英国仍然是欧洲最大的石油和凝析油生产国和出口国之一;主要出口目的地是欧盟国家,其中荷兰和德国所占份额最大[21]。
2001年至2019年间,英国天然气消费量下降(略有波动),2019年为2.805 Bcf,而2001年为3.338 Bcf。天然气产量自2004年以来迅速下降,2019年为1401 Bcf [19]。据BP称,2021年该国的消费量为769亿立方米,产量估计为327亿立方米[6]。根据英国能源简报2022年报告,2021年一次天然气产量为4470万吨油当量,总消费量为4460万吨油当量[20]。英国于 2004 年开始进口天然气,其中 3/4 通过管道进入该国;其余以液化天然气形式进口。主要供应国是挪威和卡塔尔[21]。2021年,进口量为51 Bcm,出口量为6,83 Bcm [3]。
Source: U.S. Energy Information Administration (Sep 2023) / www.eia.gov
化石燃料的生产和消费(煤炭 - 左,天然气 - 中间,石油 - 右)
自2001年以来,煤炭消费量也一直在稳步下降,2020年达到180万短吨。然而,煤炭消费呈现出多向动态,到2020年下降至780万短吨[19]。与其他来源的数据相比,我们可以注意到煤炭产量和消费量急剧下降。因此,根据 BP 2021 年的报告,煤炭消耗量为 0.21 艾焦耳,而 2015 年为 0.97 艾焦耳。产量水平也下降了两倍多,2021 年为 0.03 艾焦耳[6]。根据英国能源简报,2021 年煤炭总产量降至 110 万吨,创历史新低,比 2020 年下降 37%,消费量降至 7.4 吨[20]。
近年来,英国积极利用可再生能源发电,在电力生产普遍下降的背景下,化石燃料的份额正在下降(图3)。根据美国能源信息署的数据,2020年,该国发电量为299.53太瓦时,其中可再生能源占主导地位——44.5%,其次是化石燃料——37.8%,核电——15.3%,以及水电,包括抽水蓄能电站– 2.4%(图8)。
根据商业、能源和工业战略部的数据,2021年发电量为308.1太瓦时,其中化石燃料和核电约占60%,可再生能源包括电力。水电这一数字为40%[20]。
Sources: U.S. Energy Information Administration Sep 2023) / www.eia.gov | ||
| 图 3. 英国的发电量 |
英国在能源指数对比图中的位置如图4所示。从化石燃料的生产/消费比率来看,英国在所有主要能源国家中均处于垫底位置,从较高值到较低值不等。资源成分——石油、天然气和煤炭。与此同时,该国的石油和天然气储量也高于世界平均水平。
| Sources: 1. Crude oil proved reserves, 2021 / International Energy Statistic/Geography / U.S. Energy Information Administration (Nov 2021)*98 2. Natural gas proved reserves 2021 / International Energy Statistic / Geography / U.S. Energy Information Administration (Nov 2021) *99 3. Total recoverable coal reserves 2019 / International Energy Statistic / Geography / U.S. Energy Information Administration (Nov 2021) *81 4. Combination production-consumption for Crude oil 2018 / International Energy Statistic / Geography / U.S. Energy Information Administration (Nov 2021) *219 5. Combination production-consumption for Natural gas 2019 / International Energy Statistic / Geography / U.S. Energy Information Administration (Nov 2021) *123 6. Combination production-consumption for Coal 2019 / International Energy Statistic / Geography / U.S. Energy Information Administration (Nov 2021) *128 7. Electricity – from other renewable sources (% of total installed capacity), 2017 est. / The World Factbook / Library / Central Intelligence Agency *170 8. GDP per unit of energy use (PPP per unit of oil equivalent), 2020 *66 Primary energy consumption - BP Statistical Review of World Energy 2021/BP;GDP (purchasing power parity) - The World Factbook/Library/Central Intelligence Agency 9. Energy use (primary energy use of oil equivalent per capita) 2020 *127 Primary energy consumption – BP Statistical Review of World Energy 2021; Population - United Nations, Department of Economic and Social Affairs, Population Division (2019). World Population Prospects 2019, custom data acquired via website. Retrieved 15 November 2021*66 10. The Global Energy Architecture Performance Index Report (EAPI) 2017 / Rankings / Reports / World Economic Forum 11. Electric power consumption (kWh per capita), 2016 *217 Electricity Consumption - The World Factbook / Library / Central Intelligence Agency; Population - United Nations, Department of Economic and Social Affairs, Population Division (2019). World Population Prospects 2019, custom data acquired via website. Retrieved 15 November 2021 12. Combination of electricity production-consumption (kWh)/The World Factbook/Library/Central Intelligence Agency *216 * Total number of countries participating in ranking 图 4. 英国能源指数 |
就可再生能源(不包括水力发电)发电份额而言,英国在 2017 年在该地区的 170 个国家中排名第六, 仅次于德国和丹麦。
英国在2017年EAPI(能源建筑绩效指数)中排名第15位 ,该指数基于经济增长水平、环境安全和能源独立性(包括能源获取)。
就每单位能源消耗的国内生产总值而言,英国在 2017 年的排名领先于世界平均水平——在 66 个国家中排名第 8;而按人均能源消耗量计算,该国位居 世界第35位。
按人均用电量计算,该国位居世界第60位。根据电力生产-消费综合指标,英国在 216 个国家中排名第 36位,落后于一些欧盟国家。
图5显示了英国化石燃料行业最大基础设施项目分布的领土地图。
如前所述,已探明石油储量占该国化石燃料资源的65.3%(图5)。该国的油田主要位于海上。Buzzard 是最大的油田之一,截至 2020 年平均产量为 85,500 桶/天 [67]。
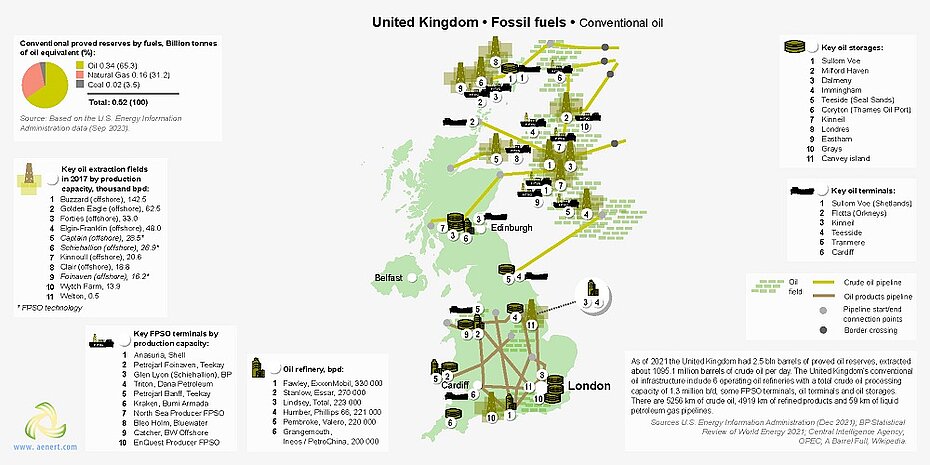
图5 英国常规石油基础设施
如上所述,近年来,由于该国油田枯竭,石油产量大幅下降,导致许多油井关闭。
2016年,英国炼油厂总装机容量为130万桶/日[23]。 最大的是埃克森美孚旗下的 Fawley,装机容量为 33 万桶/天 [24](图 5)。 石油和石油产品通过6个大型石油码头进口; Sullom, BP 石油储存终端(1,600,000 立方米)是其中最大的[25]。 原油、石油产品和液化天然气的运输通过长度分别为5.256公里、1.574公里和59公里的管道网络进行(图6)。 在该国大陆架上,石油开采也通过FPSO进行,其中最大的FPSO是壳牌公司拥有的Anasuria FPSO,储存容量为85万桶[26]。 英国的天然气开采田也主要位于海上。 其中最大的是 Cygnus,根据 2017 年的数据,平均每天产生 216 Mmscf [22]。 英国天然气系统由20个天然气压缩机站和9个天然气储存设施组成。 境内天然气输送通过管网总长28603公里,凝析气通过管网输送502公里(图6)。 天然气进口通过三个 LNG 接收站进行,其中最大的接收站位于谷物岛,吞吐量为每年 19.5 bcm [27]。 在化石燃料资源余额中,2021年煤炭占比为3.5%,同比大幅下降。 主要煤矿田由苏格兰、威尔士和英格兰共享,其中卡迪夫地区储量显着(图7)。
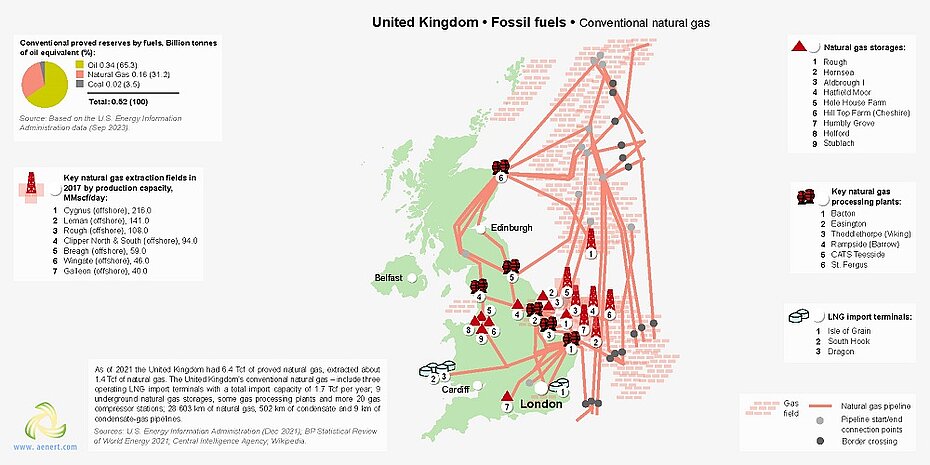 图 6. 英国化石燃料行业的基础设施:常规天然气
产量最高的油田位于东北部,2014 年煤炭产量为 2,117,114 吨[28]。
Clair 是领先的超重油开采领域之一[29]。 最大的页岩油储量位于该国南部; 该国中部地区页岩气; 苏格兰发现干酪根油储量(图7)。
自2012年取消使用水力压裂(水力压裂)生产石油和天然气的禁令以来,关于其可行性的讨论仍在继续。 因此,鉴于当地居民的大规模抗议,苏格兰议会于 2016 年投票决定暂停使用水力压裂技术。 对水力压裂的负面态度影响了拥有开发许可证的公司的决策,例如,在约克郡运营的 Third Energy [30],或西萨塞克斯、兰开夏郡和约克郡的 Cuadrilla Resources Ltd [31],他们在开发许可证方面极为谨慎。 钻井和作业井。
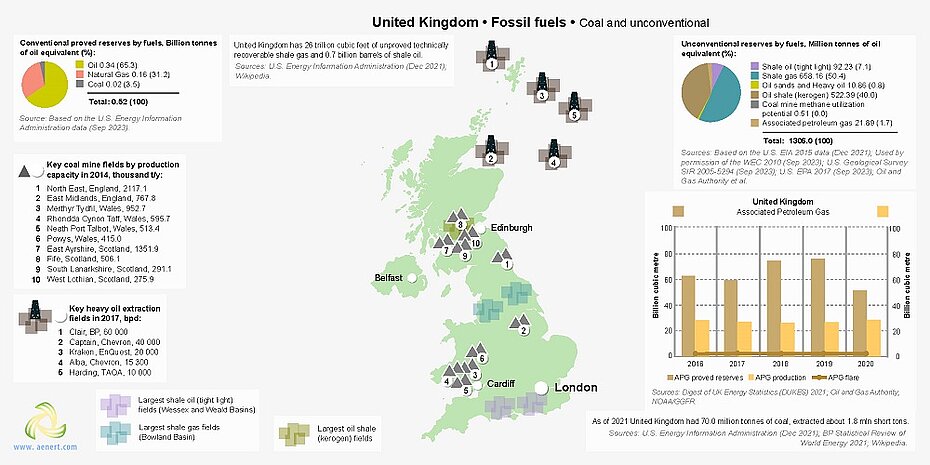
图7 英国化石燃料行业基础设施:煤炭和非常规资源
英国最大的发电基础设施的领土分布图如图8所示。
据美国能源信息署统计,2020年英国化石燃料在能源生产中的占比为37.8%(图8),核电占比为15.3%。
该国拥有大量碳氢化合物发电站,其中包括容量超过 100 兆瓦的发电厂,其中包括 12 个天然气发电厂、5 个联合型发电厂、7 个煤炭发电厂和 7 个核发电厂(图 8)。
英国最大的发电设施是:彭布罗克天然气发电厂,容量为 2,200 兆瓦[32]; Drax组合式电站,装机容量为3,960兆瓦; Cottam燃煤电厂,装机容量2000兆瓦; 和Heysham 1-2核电站,装机容量为2,610兆瓦[33,34,35]。
英国水力发电的比重并不突出,仅占总发电量的2.4%,以多座水电站、抽水蓄能电站和小型水电站为代表(图8)。
最大的抽水蓄能电站是Dinorwig,装机容量为1,728 MW。 最大的水力发电厂是 Sloy Awe,装机容量为 152.5 MW [36,37]。 英国总共注册了 427 个小型水电站,根据英国水电协会的数据,2018 年装机容量为 390 兆瓦。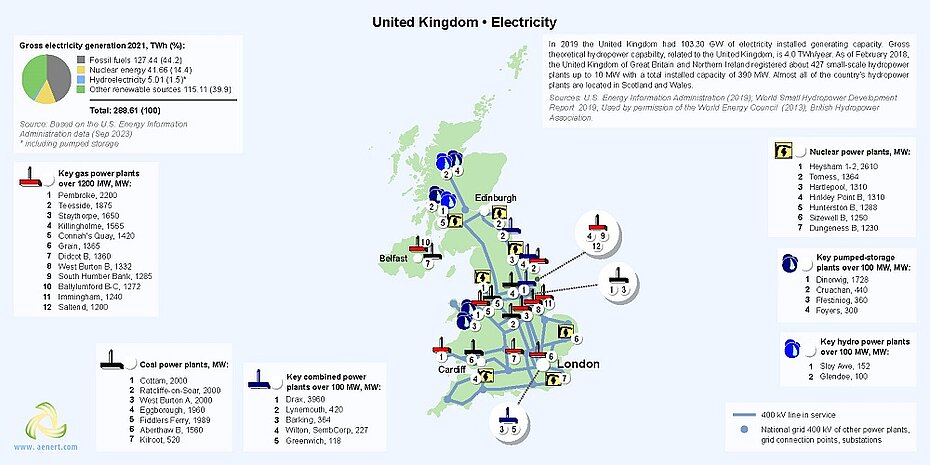
图 8. 英国的电力生产
在图 9 中,您可以看到英国用于生产可再生能源能源的主要设施。
如前所述,英国约 45% 的发电量由可再生能源提供。 2019年,不包括水电在内的可再生能源发电总量超过115太瓦时(图9)。
在风力活动频繁的地区,有22个大型海上和陆上风电场,每个风电场的容量超过140兆瓦。 2016年,英国注册了1,034个风电场,总容量为18,872兆瓦[39]。 其中最大的项目即将成为 Hornsea 项目一号,该项目目前正在建设中,容量将达到 1,197 MW [40]。 如前所述,该国某些地区的水平辐照水平可以达到3.3千瓦时/平方米,这对于能源生产来说已经足够高了。 截至2020年,英国目前约有500座太阳能发电厂在运营。五年来,英国太阳能装机容量从2014年的5,488.6兆瓦增加到2019年中期的13,258兆瓦[68]。 最大的光伏电站是克利夫山太阳能发电场,装机容量为350兆瓦[41]。
英国是海洋能技术发展的领先国家之一。 开发的主要重点是潮汐技术和利用波浪能的技术。
贝尔法斯特地区拥有用于此类技术的丰富自然资源。 2008 年,SeaGen 启动了首批潮汐站之一 - Strangford Lough,容量为 1.2 MW [42]。 Islay LIMPET 容量为 500 kW,是世界上最早将波浪能转化为电能的商业站之一[43]。 据[44]报道,Royal Haskoning DHV 计划在怀特岛附近建造一座容量为 30 MW 的大型潮汐站。 彭特兰峡湾潮汐发电厂是世界上最大的项目之一,拥有 269 台涡轮机,总容量为 398 MW [45,46]。
英国积极开发氢能,包括作为汽车能源。 截至2019年3月,全国约有18座加氢站投入运营。 氢气的运输也通过两条管道进行,总长度为40公里(图9)。 在苏格兰北部,阿伯丁市运营着欧洲最大的项目:总发电量为 1.4 兆瓦的燃料电池装置和 1 兆瓦的氢公交车项目。
图 10 显示了主要的生物能源生产设施。 2020年,英国生物能源装机容量约为7.24 GWe(图10)。
该国拥有沼气厂,以及生物质和城市垃圾加工厂、生物柴油、生物乙醇、颗粒、垃圾填埋气等行业(图10)。
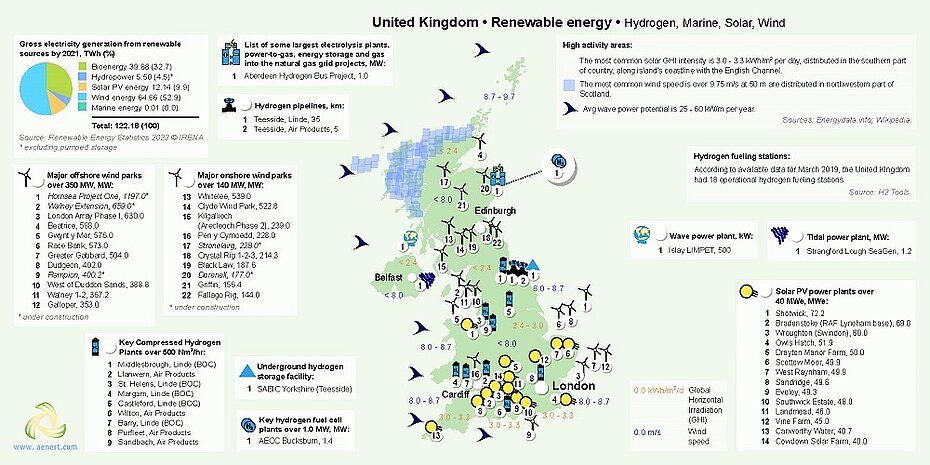
图 9. 英国的可再生能源:氢能、海洋能源、太阳能、风能
Drax Power Ltd 管理着最大的 Drax Biomass 发电厂,装机容量为 1,980 MW [47]。 英国最大的生物柴油和生物乙醇生产企业是:Seal Sands,年产量为2.84亿升;Immingham(赫尔),年产量为4.2亿升[48]。 该国最大的沼气厂是 Girvan Distillery,装机容量为 7,200 kW [49]。
其他著名企业包括: 伯明翰生物质气化厂,容量为 10.3 兆瓦 [50]; 奥尔德伯里垃圾气化厂,每年处理垃圾35万吨[51]; 和 Invergordon,每年生产 10 万吨颗粒[52]。
英国是开发等离子体废物气化技术的先驱之一。 此类最大的综合设施之一,容量为 50 MW,由 Air Products 正在英格兰东北部的蒂赛德建造 [53]。 完成试点测试后,Advanced Plasma Power 计划建造一座商业设施,用于城市废物和生物质处理以及生物替代天然气的生产,总成本为 2500 万英镑[54]。
最大的垃圾发电厂 – Belvedere,每年可处理 585,000 吨[55]。 布罗格伯勒利用垃圾填埋气产生约 38.3 MWe 的电力 [56]。
英国能源政策的目标之一是提高能源效率、减少总体能源消耗(特别是化石燃料的消耗)、减少有害排放、处理和再利用各种废物[57, 58]。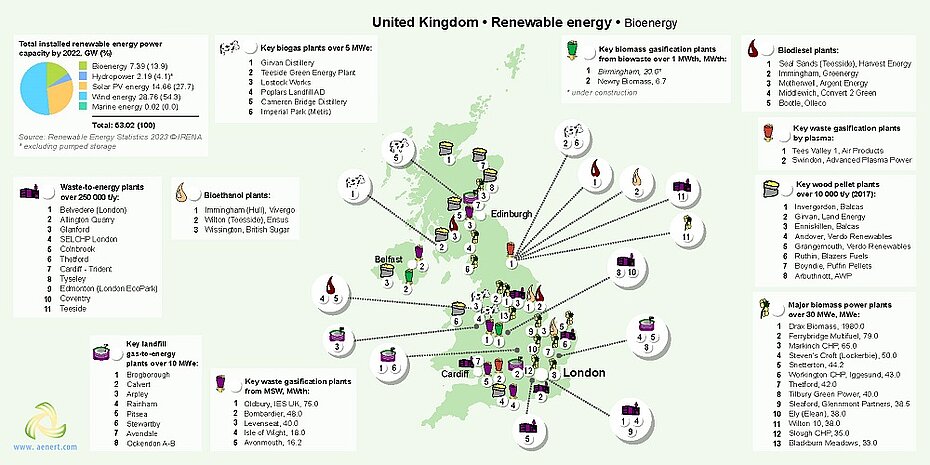
图 10. 英国的可再生能源:生物能源
作为约克郡北方发电站战略的一部分,计划投资 1000 万英镑建设颗粒生产厂 [59]。 2017 年 11 月,Snowdonia Pumped Hydro 获得了建造 99.9 MW 抽水蓄能电站 Glyn Rhonwy 的批准,这是过去 30 年来该行业最大的项目之一 [60]。 阿伯丁展览会议中心 (AECC) 拥有该国和欧洲最大的燃料电池装置之一,容量为 1.4 兆瓦[61]。 在《气候变化法案》框架内,Ofgem 已在 H21 项目中投资 900 万英镑,从天然气能源系统转向氢能源系统,到 2050 年可将碳排放量减少 80% [62]。 根据[63]中描述的研究,到2024年,世界燃料电池市场规模将达到60亿英镑。
反映英国相对于其他国家在教育和创新领域的地位的一组指数如图11所示。从该图可以看出,英国的知识文化指标水平非常高。
根据全球创新指数,2021 年英国在 132 个国家中排名第四( 见链接图表)。根据英国居民在国内外获得的专利数量,该国位居世界第八位 ,落后于德国和法国,但高于世界平均水平。同样,按有效专利数量计算,该国位居 世界第六,这表明该国有利于创新的条件。
就政府教育支出占国内生产总值的百分比而言,该国的结果接近世界平均 水平:在 177 个国家中排名第 43位。
| Sources: 1. The Global Innovation Index 2021, Rankings / Knowledge / World Intellectual Property Organization / Cornell University, INSEAD, and WIPO (2021): Energizing the World with Innovation. Ithaca, Fontainebleau, and Geneva *132 2. Patent Grants 2011-2020, resident & abroad / Statistical country profiles / World Intellectual Property Organization *185 3.Patents in Force 2020 / Statistical country profiles / World Intellectual Property Organization *109 4. QS World University Rankings 2022 *97 5. SCImago Country Rankings (1996-2020) / Country rankings / SCImago, (n.d.). SIR-SCImago Journal & Country Rank [Portal]. Retrieved 17 Nov 2021 *240 6. Internet users in 2018 / The World Factbook / Central Intelligence Agency *229 7. Internet users in 2018 (% Population) / The World Factbook / Central Intelligence Agency *229 8. Government expenditure on education, total (% of GDP), 2019 / United Nations Educational, Scientific, and Cultural Organization (UNESCO) Institute for Statistics. License: CCBY-4.0 / Data as of September 2021*177 9. Research and development expenditure (% of GDP), 2018 / UNESCO Institute for Statistics. License: CCBY-4.0 / Data *119 10. Scientific and technical journal articles, 2018 / National Science Foundation, Science and Engineering Indicators. License: CCBY-4.0 / Data *197 * Total number of countries participating in ranking 图11. 英国教育和创新指数 |
90 所英国大学被纳入 QS 大学评级。还应该指出的是,该国的国内生产总值很高,因此,从绝对值来看,教育和研究的成本是巨大的。就政府研发支出占GDP的比例而言,该国排名第22位,落后于德国、法国和挪威等许多欧洲国家。在 Scimago 排名中,英国在 240 个参与国家中排名第 3 , 在科学技术期刊活动中,英国 在 197 个国家中排名第6。
剑桥大学、牛津大学、伦敦帝国理工学院、伦敦大学学院等英国大学培养能源各个领域的专家,包括能源与资源管理、电子电气工程、能源工程、化学工程、能源技术、在
合成燃料领域,Johnson Matthey Plc、Davy Process Technology Limited、BP Exploration、CompactGTL 和 BP Chemicals Limited 正在为其发明申请专利,研究由 CompactGTL、伦敦帝国理工学院、利物浦大学和英国大学开展曼彻斯特。
OHM Ltd、自然环境研究委员会正在积极为其发明申请专利,赫瑞瓦特大学、南安普顿大学、Geotek, Ltd. 也在天然气水合物领域发表了科学著作。
在低渗透油藏油气开采领域,专利领先者包括Qinetig Ltd.、斯伦贝谢控股有限公司、Petrowell Limited,伦敦帝国理工学院、赫瑞瓦特大学、杜伦大学和英国皇家科学院也在开展研究。卡迪夫大学。
在非常规石油领域,申请专利数量最多的是Oilflow Solutions Holding Limited、Proflux Systems LLP、Imperial Chemical Industries PLC、诺丁汉大学、Prad Research and Development Ltd、赫瑞瓦特大学、伦敦帝国学院、和伯明翰大学正在从事这一领域的研究。
在伴生气领域,CompactGTL、Johnson Matthey Plc、Gas2 Limited、Accentus Plc。专利授权数量均处于领先地位。CompactGTL、Caltec Ltd.、兰卡斯特大学和 Oxford Catalyst 积极发表该领域的科学著作。专利申请的另一个重要领域是煤层气。Johnson Matthey Plc、BP PLC、Gas2 Limited、Swelltec Ltd.、伦敦帝国理工学院、赫瑞瓦特大学和帝国理工学院在这一领域都很著名。
生物能源技术的专利由庄信万丰 (Johnson Matthey Plc)、BP Biofules UK Ltd、阿斯顿大学 (Aston University)、Seab Energy Holdings Ltd 拥有。同一领域的科学研究由剑桥大学、伦敦帝国理工学院、曼彻斯特大学和许多其他科学机构进行。部门。
许多公司在可再生能源技术领域申请发明专利并开展研究。在太阳能领域,Naked Energy, Ltd.、Microsharp Corporation, Limited、ISIS Innovation, Ltd.、Silicon CVP, Plc 的专利授权数量处于领先地位。诺丁汉大学、埃克塞特大学和赫瑞瓦特大学的出版物数量最多。
在参与风电领域创新的公司和组织中,可以提及的是Blade Dynamics Limited、Ricaro UK Ltd、Qinetig Ltd.、Marine Current Turbines Limited以及斯特拉斯克莱德大学、克兰菲尔德大学和谢菲尔德哈勒姆大学。
图12所示的环境指数在一定程度上代表了该国的生态状况,但生态状况有些负面。首先,该国总体上CO 2
排放量较高 ,但人均这一指标较低。2020年,煤炭开采和加工的CO 2 排放量为22.6吨,低于波兰的161吨和德国的199吨[66]。平均而言,英国减轻此类排放后果的成本超过 342.4 万欧元(健康成本、污染成本)。相比之下,捷克共和国的这一数字为 14.52 亿欧元[64]。还应该指出的是,英国的甲烷排放量相对较高。
| Sources: 1. CO2 total emission by countries 2020 / European Commission / Joint Research Centre (JRC) / Emission Database for Global Atmospheric Research (EDGAR)*208 2. CO2 per capita emission 2020/European Commission/Joint Research Centre (JRC) / Emission Database for Global Atmospheric Research (EDGAR) *208 3. Forest area 2020 (% of land area) / The Global Forest Resources Assessment 2020 / Food and Agriculture Organization of the United Nations *234 4. Forest area change 2010-2020 (1000 ha/year) / The Global Forest Resources Assessment 2020 / Food and Agriculture Organization of the United Nations *234 5. The Environmental Performance Index (EPI) 2020 / Rankings / Yale Center for Environmental Law & Policy / Yale University *180 6. Annual freshwater withdrawals (m3 per capita), 2017 *179 Annual freshwater withdrawals, total (billion m3), 2017 – Food and Agriculture Organization, AQUASTAT data. /License: CC BY-4.0; Population – United Nations, Department of Economic and Social Affairs, Population Division (2019). World Population Prospects 2019, custom data acquired via website. Retrieved 15 November 2021 7. The National Footprint Accounts 2017 (Biocapacity Credit / Deficit) / Global Footprint Network *188 8. Methane emissions (kt of CO2 equivalent), 2018 / Data for up to 1990 are sourced from Carbon Dioxide Information Analysis Center, Environmental Sciences Division, Oak Ridge National Laboratory, Tennessee, United States. Data from 1990 are CAIT data: Climate Watch. 2020. GHG Emissions. Washington, DC: World Resources Institute. Available at: License : Attribution-NonCommercial 4.0 International (CC BY-NC 4.0) *191 9. The Climate Change Performance Index (CCPI) 2022 / Overall Results / Jan Burck, Thea Uhlich, Christoph Bals, Niklas Höhne, Leonardo Nascimento / Germanwatch, NewClimate Institute & Climate Action Network *60 * Total number of countries participating in ranking 图 12. 英国环境指数 |
与此同时,在 2022 年气候变化绩效指数 (CCPI) 中,英国在 61 个国家中排名第四,这些国家 的能源相关 CO 2 排放量占全球90 % 以上。
就森林面积占全国的百分比而言,2020年英国排名 世界第159位。然而,2010年至2020年期间出现了重新造林的趋势,根据该指标,该国排名 世界第24位。
英国在 2020 年环境绩效指数排名 (EPI) 中获得的极高评价使这一情况更加明朗,该排名主要侧重于评估各国政府的环境绩效。该国在 180 个国家中排名第四, 落后于丹麦、卢森堡和瑞士。
然而,根据基于长期观察和 50 项指标(包括气候特征变化或水资源质量、废物量、石油泄漏和其他有害物质等)的环境脆弱性指数,该国正在在 234 个国家中排名第 207 位, 被描述为“极其脆弱”。生态足迹图集评级加剧了整体负面情况,根据该评级,英国是众多生态债务国之一。
[1] List of sovereign states and dependencies by area / Wikipedia / en.wikipedia.org/wiki/List_of_sovereign_states_and_dependencies_by_area
[2] List of countries and dependencies by population density / Wikipedia / en.wikipedia.org/wiki/List_of_countries_and_dependencies_by_population_density
[3] United Kingdom / The world factbook / Library / Central Intelligence Agency / www.cia.gov
[4] GDP, PPP (constant 2011 international $) / World Bank, International Comparison Program database. License: CC BY-4.0 / Data / The World Bank / www.worldbank.org
[5] GDP per capita, PPP (current international $) / World Bank, International Comparison Program database. License: CC BY-4.0 / Data / The World Bank / www.worldbank.org
[6] BP Statistical Review of World Energy 2021 (PDF) / BP / https://www.bp.com
[7] 2006 IPCC Guidelines for National Greenhouse Gas Inventories, Volume 2, Energy, Fugitive Emissions (PDF) / The Intergovernmental Panel on Climate Change (IPCC) / www.ipcc-nggip.iges.or.jp
[8] World Shale Resource Assessments / Studies / U.S. Energy Information Administration (September 24, 2015) www.eia.gov
[9] 2010 Survey of Energy Resources / U.S. Geological Survey / energy.usgs.gov
[10] 2010 Survey of Energy Resources / 2010 / Publications / World Energy Council / www.worldenergy.org
[11] UK Oil and Gas Reserves and Resources / www.nstauthority.co.uk/media/7764/rr-report_final-22-september-2021.pdf
[12] Solar resource data obtained from the Global Solar Atlas, owned by the World Bank Group and provided by Solargis / Global Solar Atlas / globalsolaratlas.info
[13] Wind Map / Global Wind Atlas 2.0, a free, web-based application developed, owned and operated by the Technical University of Denmark (DTU) in partnership with the World Bank Group, utilizing data provided by Vortex, with funding provided by the Energy Sector Management Assistance Program (ESMAP). For additional information: globalwindatlas.info
[14] World Energy Resources: Hydro World Energy Council / 2013 / Publications / World Energy Council / www.worldenergy.org
[15] Wave Power / Wikipedia / https://en.wikipedia.org/wiki/Wave_power
[16] Agricultural land (% of land area) /Food and Agriculture Organization, electronic files and web site. License: CC BY-4.0 / Data / The World Bank / www.worldbank.org
[17] Forest area (% of land area) /Food and Agriculture Organization, electronic files and web site. License: CC BY-4.0 / Data / The World Bank / www.worldbank.org
[18] What a Waste 2012 (PDF) / Resources / The World Bank / www.worldbank.org
[19] International Energy Statistic / Geography / U.S. Energy Information Administration / www.eia.gov/beta/international/
[20] UK Energy in Brief 2022 (PDF) / Uploads / Department for Business, Energy and Industrial Strategy / assets.publishing.service.gov.uk
[21] United Kingdom / Statistics / © OECD / IEA 2018, IEA Publishing, Licence: www.iea.org/t&c / International Energy Agency / www.iea.org
[22] PPRS Production Data / Oil and Gas Authority / itportal.ogauthority.co.uk
[23] OPEC Annual Statistical Bulletin 2017 (PDF) / Publications / Organization of the Petroleum Exporting Countries (OPEC)/ www.opec.org
[24] United Kingdom / ExxonMobil / corporate.exxonmobil.com
[25] Terminal petrolier de Sullom / Europetrole / www.euro-petrole.com
[26] Anasuria FSPO / A Barell Full / abarrelfull.wikidot.com/anasuria-fpso
[27] Storage Map: Information by point / Gas Infrastructure Europe (GIE) / www.gie.eu
[28] Mine & Quarry / British Geological Survey / www.bgs.ac.uk
[29] Clair oilfield / Wikipedia / en.wikipedia.org/wiki/Clair_oilfield
[30] Assets and Operations / Third Energy / http://www.third-energy.com
[31] Powering th Future / Cuadrilla / cuadrillaresources.com
[32] Pembroke / RWE Generation SE / www.rwe.com
[33] Drax power station / Wikipedia / en.wikipedia.org/wiki/Drax_power_station
[34] Cottam and West Burton A / EDF Energy / www.edfenergy.com
[35] Nuclear Power in the United Kingdom / Country Profiles / World Nuclear Association / www.world-nuclear.org
[36] Dinorwig Power Station / DOE Global Energy Storage Database / www.energystorageexchange.org
[37] Sloy / Our projects and assets / Scottish and Southern Energy (SSE) / sse.com
[38] World Small Hydropower Development Report 2016 – United Kingdom of Great Britain and Northern Ireland (PDF) / Small Hydropower World / www.smallhydroworld.org
[39] UNITED KINGDOM (PDF) / WWEA Policy Paper Series (PP-02-18-E), April 2018 / Alain Ulazia, Christian Arriola / WWEA / www.wwindea.org/wp-content/uploads/2018/06/UK_full.pdf
[40] UK Wind Energy Plants Database (UKWED) / Renewable UK / www.renewableuk.com
[41] Shotwick / British Solar Renewables / britishrenewables.com
[42] SeaGen / Wikipedia / en.wikipedia.org/wiki/SeaGen
[43] Islay LIMPET / Wikipedia / en.wikipedia.org/wiki/Islay_LIMPET
[44] Tidal array scheduled for deployment off the Isle of Wight in England / Hydro World.com / https://www.hydroworld.com
[45] Tidal energy project to be constructed in the Pentland Firth / BBC / www.bbc.com
[46] First Tidal Energy Turbine With Lockheed Martin Technology Deployed Off Scotland Coast / Locheed Martin / news.lockheedmartin.com
[47] Event Complex Aberdeen (TECA) to Feature UK's Largest Hydrogen Fuel Sell Installatio / April 8, 2019 / fuelcellsworks.com/news/event-complex-aberdeen-teca-to-feature-uks-largest-hydrogen-fuel-cell-installation/
[48] The UK’s first hydrogen production and bus refuelling station was officially opened today, as part of a £19 million green transport demonstration project / 11 March 2015, Press Releases / www.boconline.co.uk/en/news-and-media/press_releases/news2015-03-11
[49] Digest of UK Energy Statistics (DUKES): electricity (PDF) / GOV.UK / www.gov.uk
[50] Ecofys UK biofuel industry overview, 2013 (PDF) / GOV.UK / www.gov.uk
[51] AD Portal Biogas Map / www.biogas-info.co.uk
[52] Birmingham Bio Power Plant, Tyseley / Power Technology / www.power-technology.com
[53] Giant recycling plant being built in Oldbury / August, 13, 2013 / Halesowen News / www.halesowennews.co.uk
[54] Global Wood Pellet Industry and Trade Study 2017 (PDF) / IEA Bioenergy Task 40: Sustainable International Bioenergy Trade / task40.ieabioenergy.com
[55] Air Products to Ditch Plasma Gasification Waste to Energy Plants in Teesside / April 5, 2016 / Waste Management World / waste-management-world.com
[56] References & Partners / Advanced Plasma Power / advancedplasmapower.com
[57] Belvedere (London) Waste-to-energy plant / Industry About / www.industryabout.com
[58] Search List of Renewable Generators/ Renewable Energy Foundation (REF) / www.ref.org.uk
[59] BEIS: Energy Policy (PDF)/ The Department for Business, Energy and Industrial Strategy's / assets.publishing.service.gov.uk
[60] BEIS: Environmental Policy (PDF)/ The Department for Business, Energy and Industrial Strategy's / assets.publishing.service.gov.uk
[61] £10 million pellet plant planned for Yorkshire / Bioenergy Insight / www.bioenergy-news.com
[62] 99.9-MW Glyn Rhonwy pumped-storage hydropower plant gets approval / 03/10/2017 / Michael Harris / HydroWorld.com / www.hydroworld.com
[63] UK’s Largest Hydrogen Cell Installation Arrives at New AECC / November 13, 2017 / FuelCellsWorks / fuelcellsworks.com
[64] Ofgem awards £9 million to support pioneering hydrogen project H21 / December 04, 2017 / FuelCellsWorks / fuelcellsworks.com
[65] Global fuel cell market to hit $6 billion by 2024 / December 18, 2017/ STEPHEN VAGUS / Hydrogen fuel news / www.hydrogenfuelnews.com
[66] Carbon dioxide emissions from coal use / Statista / www.statista.com
[67] Buzzard oil field / Wikipedia / en.wikipedia.org
[68] The UK’s 5 Biggest Solar Farms / 1 February 2022 / Deege Solar / www.deegesolar.co.uk
图表和曲线的来源在图像下方指定。
有关英国能源行业的更多信息,请参见此处
