
| Oman / Sultanate of Oman | ||
|---|---|---|
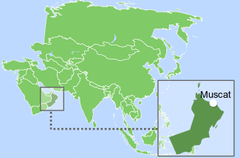
| Capital: Muscat | Density: 15/km2 | Currency: Omani rial (OMR) |
| Official languages: Arabic | Life expectancy at birth: 76.9 years | GDP (PPP): $200.295 billion (2023 est.) |
| National Day: 18 November | Area (land): 309,500 km2 | GDP - per capita (PPP): $39,336 (2023 est.) |
| Population: 3,764,348 (2022 est.) | Coastline: 2,092 km | Internet country code: .om, عمان. |
Source: [1,2,3,4,5]
根据 2022 年统计,阿曼领土面积居世界第 72,拥有约370万人。就人口密度而言,该国位居世界第219位[1,2,3]。该国海岸线总长度为2,092公里[3]。阿曼的政治形式是绝对君主制,阿曼苏丹既是国家元首又是政府首脑。该国的行政地图分为 11 个省 [3]。阿曼相对于其他国家的排名是根据一系列经济、能源、创新和教育指数确定的至于反映环境状况的指标。经济指标包括人均GDP、年均GDP增长率、高新技术出口等。能源指数列表包括石油和天然气探明储量、产耗比、能源使用量等。每个指数都有一个包含的成员国排名列表。由于每个指数中每个评级的国家数量不同,因此评级中感兴趣的国家的位置显示在一个特殊的图表上,其中纵轴是从0到1的统一相对刻度,而横轴则表示与下面给出的描述相关的各种指数和相应的数字。因此,在这样一个相对的“0-1”图中,国家的位置按照其在地图中的位置成比例地用点来标记。原始评级列表。如果该国在所选指标方面处于领先地位,则将在相关图表“0-1”的上部绿色区域中标记为接近 1,如果该国在评级列表中属于局外人,则将标记为接近 1图表下方红色区域“0-1”等阿曼经济指数排名排名:
| Sources: 1. GDP (purchasing power parity), 2020 est. / The World Factbook/Library/Central Intelligence Agency *228 2. GDP - per capita (PPP), 2020 / The World Factbook/Library/Central Intelligence Agency *229 3. Inflation rate (consumer prices), 2019 est. / The World Factbook/Library/Central Intelligence Agency *228 4. Charges for the use of intellectual property, receipts (BoP, current US$), 2020 / International Monetary Fund, Balance of Payments Statistics Yearbook, and data files. / License: CC BY-4.0 *88 5. The Global Competitiveness Index 2019 / Rankings / Reports / World Economic Forum *141 6. High-technology exports (current US$) 2019-2020 / United Nations, Comtrade database through the WITS platform / License: CCBY-4.0 / Data *134 7. 2021 Index of Economic Freedom / International Economies / The Heritage Foundation *178 8. Reserves of foreign exchange and gold, 2017 est. / The World Factbook / Library / Central Intelligence Agency *195 9. Annual average GDP growth in %, for the last 10 years (2011-2020) / World Bank national accounts data, and OECD National Accounts data files / License: CC BY-4.0 *206 10. Public debt (% of GDP), 2017 est. / The World Factbook / Library / Central Intelligence Agency(from smallest to largest) *210 * Total number of countries participating in ranking 图1.阿曼经济指数 |
阿曼拥有大量已探明化石燃料储量。石油储量占世界总储量的0.32%,天然气占世界总储量的0.32%[6]。阿曼人口约占世界人口的0.06%。但与此同时,阿曼的石油和天然气储量却明显低于世界领先国家。例如,石油储量比阿拉伯联合酋长国少9倍多,而天然气储量比卡塔尔少36倍多[6]。应该考虑到,在阿曼的大多数油田中,石油具有高密度和粘度,因此在提取时使用成本高昂的蒸汽吞吐方法。
表1.阿曼化石能源资源
| Resource /Explanations | Crude oil* | Natural gas* | Coal | Tight Oil** | Shale Gas** |
|---|---|---|---|---|---|
| Value | 5.373 (0.32%) | 23 (0.32%) | 0 | 6.2 | 48.3 |
| Unit | billion barrels | Tcf | - | billion barrels | Tcf |
| Year | 2021 | 2020 | - | 2015 | 2015 |
| Source | [6] | [6] | [-] | [7] | [7] |
*括号内提供了该国储量占世界总储量的比例
**未经证实的技术可采
以吨油当量计算,根据根据2022年的数据,按燃料类型划分的常规探明储量为:石油55.5%,天然气44.5%(图5)。除常规油气资源外,阿曼还拥有大量致密油和页岩气储量[7]。
由于地处沙漠地区,阿曼水力发电技术的利用并不广泛。可行,因为该国几乎没有永久水资源。阿曼风电发展潜力巨大。最常见的风速在 50 m 处超过 6.00 m/s 至 8.00 m/s,分布在该国东南部、佐法尔省和乌斯塔省以及阿拉伯海沿岸的一些地方。
表2. 阿曼的可再生能源资源
| Resource/ Explanations | Solar Potential (DNI)* | Wind Potential (50 м)* | Bio Potential (agricultural area) | Bio Potential (forest area) | Municipal Solid Waste |
|---|---|---|---|---|---|
| Value | 5.0-6.0 | 4.5-6.0 | 4.7 | 0.0 | 1.19 |
| Unit | kWh/m2/day | m/s | % of land area | % of land area | kg/per capita/day |
| Year | 2018 | 2018 | 2020 | 2020 | 2018 |
| Source | [8] | [9] | [10] | [11] | [12] |
*全国大部分领土
与所有南方国家一样,阿曼拥有发展太阳能发电的有利条件。
该国许多地区的太阳活动平均每天为 6.0 kWh/m2。 DNI 太阳强度最高达到每天 6.8-7.1 kWh/m2,记录在南部、佐法尔省和部分地区位于阿曼东北部三个省之间。
由于该国缺乏森林,农业用地面积狭小,开发生物能源的原材料很少。然而,利用动物粪便和废水发电是有潜力的[13]。
根据[6],2022年阿曼一次能源总产量为3.753万亿英热单位,而消费量为1.411万亿英热单位。 因此,国内消费占一次能源生产的比例为37.6%,这意味着阿曼在很大程度上实现了能源独立。 该国是重要的原油和天然气出口国,特别是亚洲国家。 根据《BP 2022 年世界能源统计年鉴》,2021 年阿曼一次能源消费量为 1.50 艾焦耳,其中天然气占主导地位,占 71%,其次是石油,占 28%,煤炭占 0.7%[14]。
Source: U.S. Energy Information Administration (Mar 2024) / www.eia.gov
图 2. 美国化石燃料的生产和消费阿曼(左 - 煤炭,中间 - 天然气,右 - 石油)
尽管近年来化石燃料消耗量有所增加,但阿曼的天然气和石油产量大幅超过国内需求。 2022年,石油产量是消费量的四倍多,天然气产量大约是消费量的一倍半。如上所述,天然气约占阿曼国内能源消耗的70%。阿曼唯一完全进口的化石产品是煤炭,尽管消耗量微不足道。过去十年,阿曼的总发电量和消费量增长了近两倍。 2022年,约99%的电力由火力发电厂生产。
Sources: U.S. Energy Information Administration (Mar 2024) / www.eia.gov | ||
图 3.阿曼的发电情况 |
可再生能源对整体电力生产平衡几乎没有贡献,通过太阳能发电厂仅达到 0.6% 的份额。
提供了阿曼能源指数图表如下图所示。
| Sources: 1. Crude oil proved reserves, 2021 / International Energy Statistic/Geography / U.S. Energy Information Administration (Nov 2021)*98 2. Natural gas proved reserves 2021 / International Energy Statistic / Geography / U.S. Energy Information Administration (Nov 2021) *99 3. Total recoverable coal reserves 2019 / International Energy Statistic / Geography / U.S. Energy Information Administration (Nov 2021) *81 4. Combination production-consumption for Crude oil 2018 / International Energy Statistic / Geography / U.S. Energy Information Administration (Nov 2021) *219 5. Combination production-consumption for Natural gas 2019 / International Energy Statistic / Geography / U.S. Energy Information Administration (Nov 2021) *123 6. Combination production-consumption for Coal 2019 / International Energy Statistic / Geography / U.S. Energy Information Administration (Nov 2021) *128 7. Electricity – from other renewable sources (% of total installed capacity), 2017 est. / The World Factbook / Library / Central Intelligence Agency *170 8. GDP per unit of energy use (PPP per unit of oil equivalent), 2020 *66 Primary energy consumption - BP Statistical Review of World Energy 2021/BP;GDP (purchasing power parity) - The World Factbook/Library/Central Intelligence Agency 9. Energy use (primary energy use of oil equivalent per capita) 2020 *127 Primary energy consumption – BP Statistical Review of World Energy 2021; Population - United Nations, Department of Economic and Social Affairs, Population Division (2019). World Population Prospects 2019, custom data acquired via website. Retrieved 15 November 2021*66 10. The Global Energy Architecture Performance Index Report (EAPI) 2017 / Rankings / Reports / World Economic Forum 11. Electric power consumption (kWh per capita), 2016 *217 Electricity Consumption - The World Factbook / Library / Central Intelligence Agency; Population - United Nations, Department of Economic and Social Affairs, Population Division (2019). World Population Prospects 2019, custom data acquired via website. Retrieved 15 November 2021 12. Combination of electricity production-consumption (kWh)/The World Factbook/Library/Central Intelligence Agency *216 * Total number of countries participating in ranking 图 4。阿曼能源指数 |
阿曼是世界上天然气和石油储量领先的国家之一,产量超过消费率。根据提供的数据,阿曼的可再生能源发电量极低。然而,阿曼计划在未来几年启动多个可再生能源项目,从而实现该国巨大的太阳能潜力。该国的电力生产和消费比例良好。就每单位能源使用量的国内生产总值而言,阿曼的排名大幅低于世界平均水平。相反,人均能源使用指标却很高。
图5显示了阿曼化石燃料行业最大基础设施项目分布的领土地图。如前所述,石油储量占常规探明储量的55.5%,天然气占44.5%(图5)。 .5).
主要开发油气田位于该国中部和西北部,而主要稠油开采田则位于较靠近南部地区地区。阿曼的常规石油基础设施包括 2 座运营中的炼油厂,原油总加工能力为 303 000 桶/日;一些石油码头和储油库。港口城市杜库姆的另一座炼油厂将于 2023 年底投产,产能为 23 万桶/日。原油管道长 3558 公里,成品油管道长 264 公里。
阿曼是世界上重油开采最先进的国家之一。传统上,专门针对该领域的国际主题展览和会议都在这里举行。许多石油公司应用先进技术开发稠油油田。 2018年,阿曼石油开发公司和GlassPoint Solar启动了独特的Miraah CSP项目的第一阶段,该项目结合了集中太阳能和将蒸汽注入含油地层的技术,以随后降低石油粘度并促进其输送到地面。太阳能通过抛物面镜聚集,其设计由 GlassPoint Solar 开发。聚光器的热容量为 1,021 MW,这绝对是世界纪录。最终设计的日蒸汽产生量为6000吨。这使得可以显着减少天然气消耗并减少向大气中的有害排放[15]。
常规天然气包括:一个正在运营的液化天然气出口终端,总出口能力为1080万液化天然气每年吨;一些天然气处理厂;天然气管道4224公里,凝析油管道106公里。
图5.阿曼化石燃料行业基础设施(点击地图查看PDF 版本)
2019年,阿曼发电装机容量为8.9吉瓦。阿曼没有水电能源工业。如前所述,2022年约99%的电力由火力发电厂生产。总容量为105兆瓦的大型太阳能发电厂Amin位于尼姆尔地区附近,于2020年开始商业运营。不过,计划建设容量高达500兆瓦的太阳能发电厂。其中之一是 Ibri 2 太阳能发电场,于 2022 年 1 月在达希拉省开业 [16]。阿曼在佐法尔省拥有一座大型风电场,装机容量为 50 兆瓦。
图 6.阿曼的电力生产和可再生能源(点击地图查看PDF 版本)
阿曼政府宣布有意通过绿色能源项目扩大发电能力,并计划到2030年将可再生能源装机容量增加约4吉瓦,并计划到2040年约40%的电力来自可再生能源。此外,还有数吉瓦的装机容量。大规模的绿色氢能项目已经宣布,包括由 25 吉瓦风能和太阳能供电的 14 吉瓦工厂[17]。
| Sources: 1. The Global Innovation Index 2021, Rankings / Knowledge / World Intellectual Property Organization / Cornell University, INSEAD, and WIPO (2021): Energizing the World with Innovation. Ithaca, Fontainebleau, and Geneva *132 2. Patent Grants 2011-2020, resident & abroad / Statistical country profiles / World Intellectual Property Organization *185 3.Patents in Force 2020 / Statistical country profiles / World Intellectual Property Organization *109 4. QS World University Rankings 2022 *97 5. SCImago Country Rankings (1996-2020) / Country rankings / SCImago, (n.d.). SIR-SCImago Journal & Country Rank [Portal]. Retrieved 17 Nov 2021 *240 6. Internet users in 2018 / The World Factbook / Central Intelligence Agency *229 7. Internet users in 2018 (% Population) / The World Factbook / Central Intelligence Agency *229 8. Government expenditure on education, total (% of GDP), 2019 / United Nations Educational, Scientific, and Cultural Organization (UNESCO) Institute for Statistics. License: CCBY-4.0 / Data as of September 2021*177 9. Research and development expenditure (% of GDP), 2018 / UNESCO Institute for Statistics. License: CCBY-4.0 / Data *119 10. Scientific and technical journal articles, 2018 / National Science Foundation, Science and Engineering Indicators. License: CCBY-4.0 / Data *197 * Total number of countries participating in ranking 图7.阿曼的教育和创新指数 |
阿曼的互联网用户占其人口的比例相对较高。互联网用户的绝对数量略低,但仍高于全球平均水平。阿曼在 SCImago 国家排名中以及在专业科技期刊的出版物数量和专利活动方面处于非常有利的位置。该国在政府教育支出(占国内生产总值的百分比)方面也高于世界平均水平。该国在政府研发支出以及 2022 年 QS 世界大学排名中排名相当靠后。
| Sources: 1. CO2 total emission by countries 2020 / European Commission / Joint Research Centre (JRC) / Emission Database for Global Atmospheric Research (EDGAR)*208 2. CO2 per capita emission 2020/European Commission/Joint Research Centre (JRC) / Emission Database for Global Atmospheric Research (EDGAR) *208 3. Forest area 2020 (% of land area) / The Global Forest Resources Assessment 2020 / Food and Agriculture Organization of the United Nations *234 4. Forest area change 2010-2020 (1000 ha/year) / The Global Forest Resources Assessment 2020 / Food and Agriculture Organization of the United Nations *234 5. The Environmental Performance Index (EPI) 2020 / Rankings / Yale Center for Environmental Law & Policy / Yale University *180 6. Annual freshwater withdrawals (m3 per capita), 2017 *179 Annual freshwater withdrawals, total (billion m3), 2017 – Food and Agriculture Organization, AQUASTAT data. /License: CC BY-4.0; Population – United Nations, Department of Economic and Social Affairs, Population Division (2019). World Population Prospects 2019, custom data acquired via website. Retrieved 15 November 2021 7. The National Footprint Accounts 2017 (Biocapacity Credit / Deficit) / Global Footprint Network *188 8. Methane emissions (kt of CO2 equivalent), 2018 / Data for up to 1990 are sourced from Carbon Dioxide Information Analysis Center, Environmental Sciences Division, Oak Ridge National Laboratory, Tennessee, United States. Data from 1990 are CAIT data: Climate Watch. 2020. GHG Emissions. Washington, DC: World Resources Institute. Available at: License : Attribution-NonCommercial 4.0 International (CC BY-NC 4.0) *191 9. The Climate Change Performance Index (CCPI) 2022 / Overall Results / Jan Burck, Thea Uhlich, Christoph Bals, Niklas Höhne, Leonardo Nascimento / Germanwatch, NewClimate Institute & Climate Action Network *60 * Total number of countries participating in ranking 图8.阿曼的环境指数 |
阿曼属于二氧化碳和甲烷排放量较高的国家之一。这些事实也是其在环境绩效指数(EPI)中排名相对较低的原因。该国在两项指标上略高于世界平均水平:年度淡水抽取量和甲烷排放量(千吨二氧化碳2当量)。总体来看,全国环境状况有待明显改善。
[1] List of sovereign states and dependencies by area / Wikipedia / https://en.wikipedia.org/wiki/List_of_sovereign_states_and_dependencies_by_area
[2] List of countries and dependencies by population density / Wikipedia / https://en.wikipedia.org/wiki/List_of_countries_and_dependencies_by_population_density
[3] Oman / The-world-factbook / Library / Central Intelligence Agency / https://www.cia.gov/
[4] GDP, PPP (constant 2011 international $) / World Bank, International Comparison Program database. License: CC BY-4.0 / Data / The World Bank / http://www.worldbank.org/
[5] GDP per capita, PPP (current international $)/ World Bank, International Comparison Program database. License: CC BY-4.0 / Data / The World Bank / http://www.worldbank.org/
[6] International Energy Statistic / Geography / U.S. Energy Information AdministrationJanuary, 7, 2019 / http://www.eia.gov/
[7] World Shale Resource Assessments / Analysis / U.S. Energy Information Administration (September 24, 2015) / https://www.eia.gov/
[8] Solar resource data obtained from the Global Solar Atlas, owned by the World Bank Group and provided by Solargis / Global Solar Atlas / http://globalsolaratlas.info/
[9] Wind Map / Global Wind Atlas 2.0, a free, web-based application developed, owned and operated by the Technical University of Denmark (DTU) in partnership with the World Bank Group, utilizing data provided by Vortex, with funding provided by the Energy Sector Management Assistance Program (ESMAP). For additional information: https://globalwindatlas.info
[10] Agricultural land (% of land area) / Food and Agriculture Organization, electronic files and web site. License: CC BY-4.0 / Data / The World Bank / http://www.worldbank.org
[11] Forest area (% of land area) /Food and Agriculture Organization, electronic files and web site. License: CC BY-4.0 / Data / The World Bank / http://www.worldbank.org
[12] World Bank What a Waste / Data / The World Bank / http://www.worldbank.org
[13] Biomass: A promising source for renewable energy development in Oman / 6 November 2022 / Observer / https://www.omanobserver.om
[14] BP Statistical Review of World Energy 2020 - 2022 (PDF) / BP / https://www.bp.com/
[15] Miraah/ 330 MW SOLAR THERMAL PROJECT IN THE SULTANATE OF OMAN www.glasspoint.com/projects/miraah
[16] Oman inaugurates 500MW Ibri 2 solar field / www.pv-magazine.com/2022/01/24/oman-inaugurates-500mw-ibri-2-solar-field/
[17] Oman - Country Commercial Guide / Country Commercial Guides / International Trade Administration / www.trade.gov
图表和曲线的来源已在图像下方指定。
有关阿曼能源行业的更多信息,请参阅此处